Probability is the branch of mathematics that measures the chance of occurrence of a particular event, turning everyday ideas like 'likely', 'unlikely', or 'impossible' into precise numbers between 0 and 1. It grew out of the study of games of chance — tossing coins, rolling dice, drawing cards — but its methods now underpin weather forecasting, insurance and risk assessment, quality control in factories, medical testing, and countless other real-life decisions made under uncertainty.
At the heart of probability lies a simple formula, P(A) = n(A)/n(S), which compares the number of favourable outcomes of an event to the total number of possible outcomes in the sample space. Building on this single idea, the complement rule lets us find the probability that an event does NOT happen, while relative frequency and expected frequency extend probability thinking to real recorded data — surveys, experiments, and production records — allowing predictions to be made about how often an event should occur in a large number of trials.
Learning Objectives
- Define an experiment, outcome, favourable outcome, sample space, event, and sample point, with suitable examples.
- State and apply the basic formula for probability, P(A) = n(A)/n(S), and explain why 0 ≤ P(A) ≤ 1.
- Identify certain, impossible, likely, unlikely, and equally likely events, and state their probabilities.
- Find the probability of a single event using a single die and using the 36-outcome sample space of two dice.
- State and apply the complement rule, P(A') = 1 – P(A), to find the probability of an event not occurring.
- Apply probability concepts to real-life problems involving targets, bags of balls, and playing cards.
- Define relative frequency, calculate it from a frequency table, and use it as an estimate of probability.
- Define expected frequency, calculate it using Expected frequency = N × P(A), and apply it to real-life situations.
Key Concepts
13.0 Introduction to Probability
Probability is a way of measuring the chance of occurrence of a particular event, expressed as a number between 0 and 1. An event that is certain to happen has a probability of 1, an event that can never happen has a probability of 0, and every other event falls somewhere between these two extremes depending on how likely it is.
The probability of an event A is defined by the formula P(A) = n(A)/n(S), where n(A) is the number of favourable outcomes — the outcomes that satisfy the event A — and n(S) is the total number of possible outcomes in the sample space S. This single formula is the foundation on which every other idea in this unit, including the complement rule, relative frequency, and expected frequency, is built.
13.1 Basic Concepts of Probability
An experiment is any process that generates a result, such as tossing a coin, rolling a die, or drawing a card from a deck. Each individual result produced by an experiment is called an outcome, and an outcome that matches the particular result we are interested in is called a favourable outcome. The sample space S is the set of all possible outcomes of an experiment — for tossing a single coin, S = {H, T}; for rolling a single die, S = {1, 2, 3, 4, 5, 6}. Each individual member of the sample space is called a sample point.
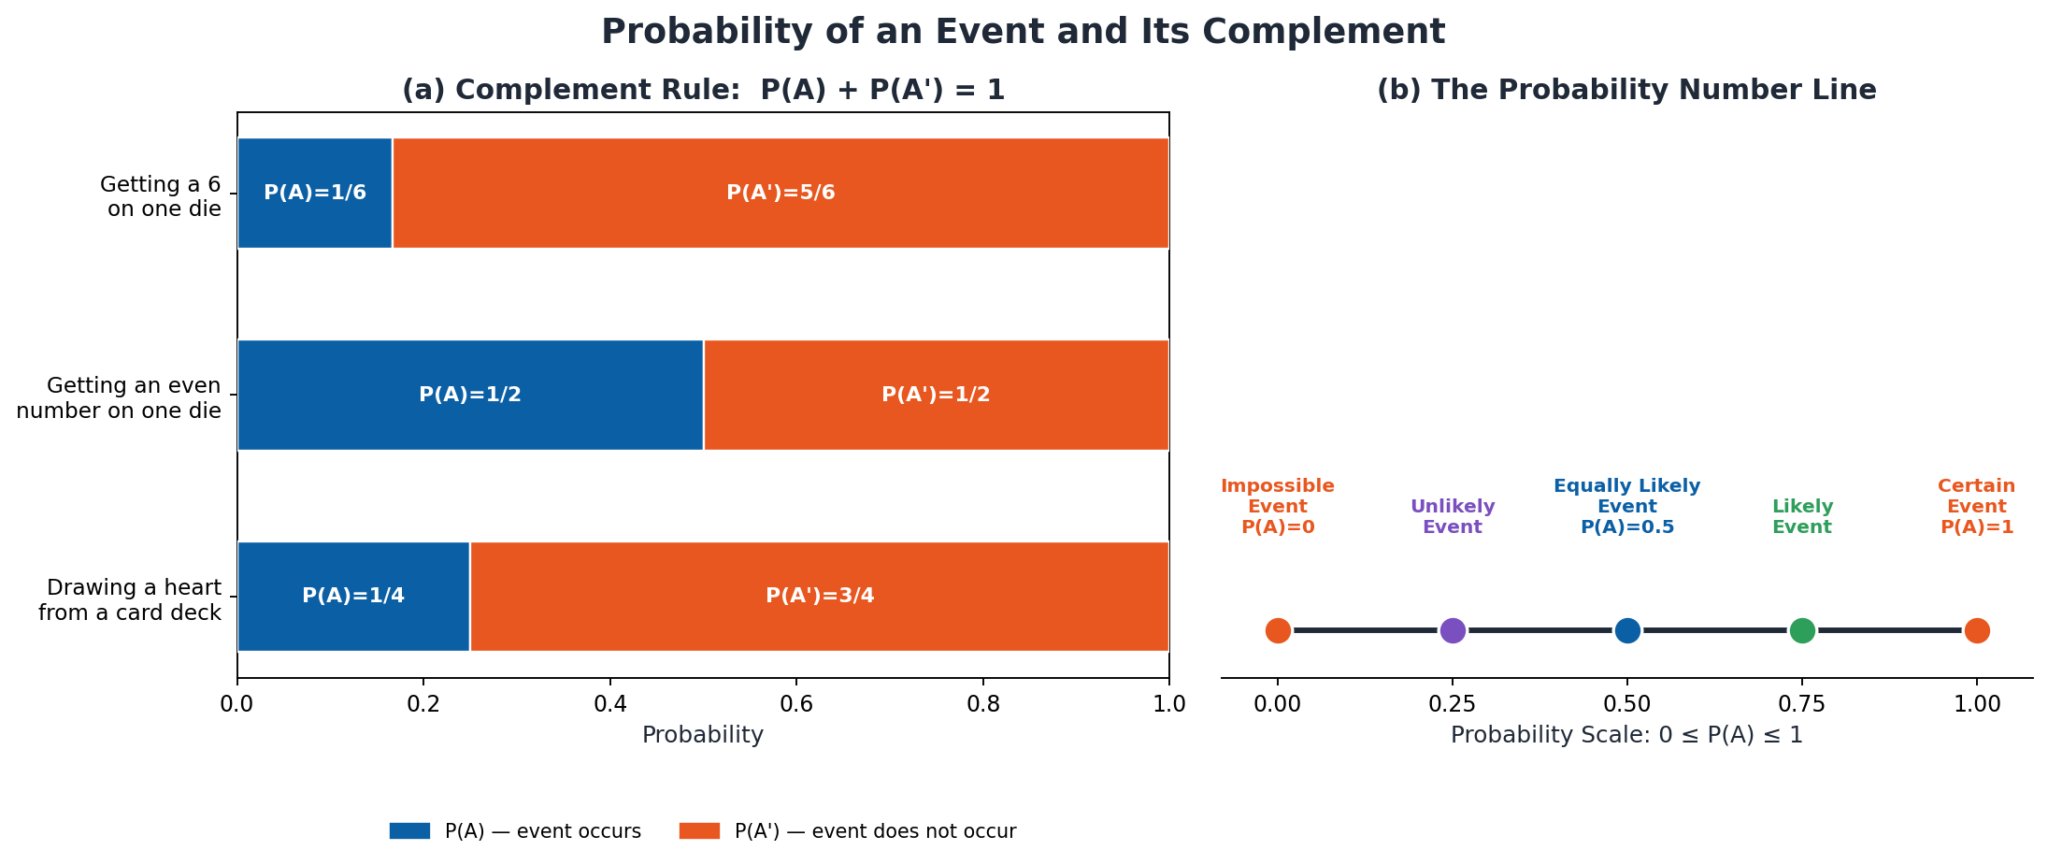
An event is any subset of the sample space — a collection of one or more outcomes that we are interested in. For example, if a die is rolled and A is the event 'an even number appears', then A = {2, 4, 6} and n(A) = 3. Events are classified by how likely they are: a certain event is one that must happen, with P(A) = 1 (for example, getting a number from 1 to 6 on a die); an impossible event can never happen, with P(A) = 0 (for example, getting a 7 on an ordinary die); a likely event has a probability greater than 0.5, an unlikely event has a probability less than 0.5, and an equally likely event has a probability of exactly 0.5, such as getting heads on a single coin toss. For any event A, the probability always satisfies 0 ≤ P(A) ≤ 1.
13.2 Probability of a Single Event
For an experiment with a single die, the sample space is S = {1, 2, 3, 4, 5, 6}, so n(S) = 6. To find the probability of any event, we count the favourable outcomes within this sample space and divide by 6 — for example, the probability of getting a number divisible by 3 is n(A)/n(S) = 2/6 = 1/3, since A = {3, 6}.
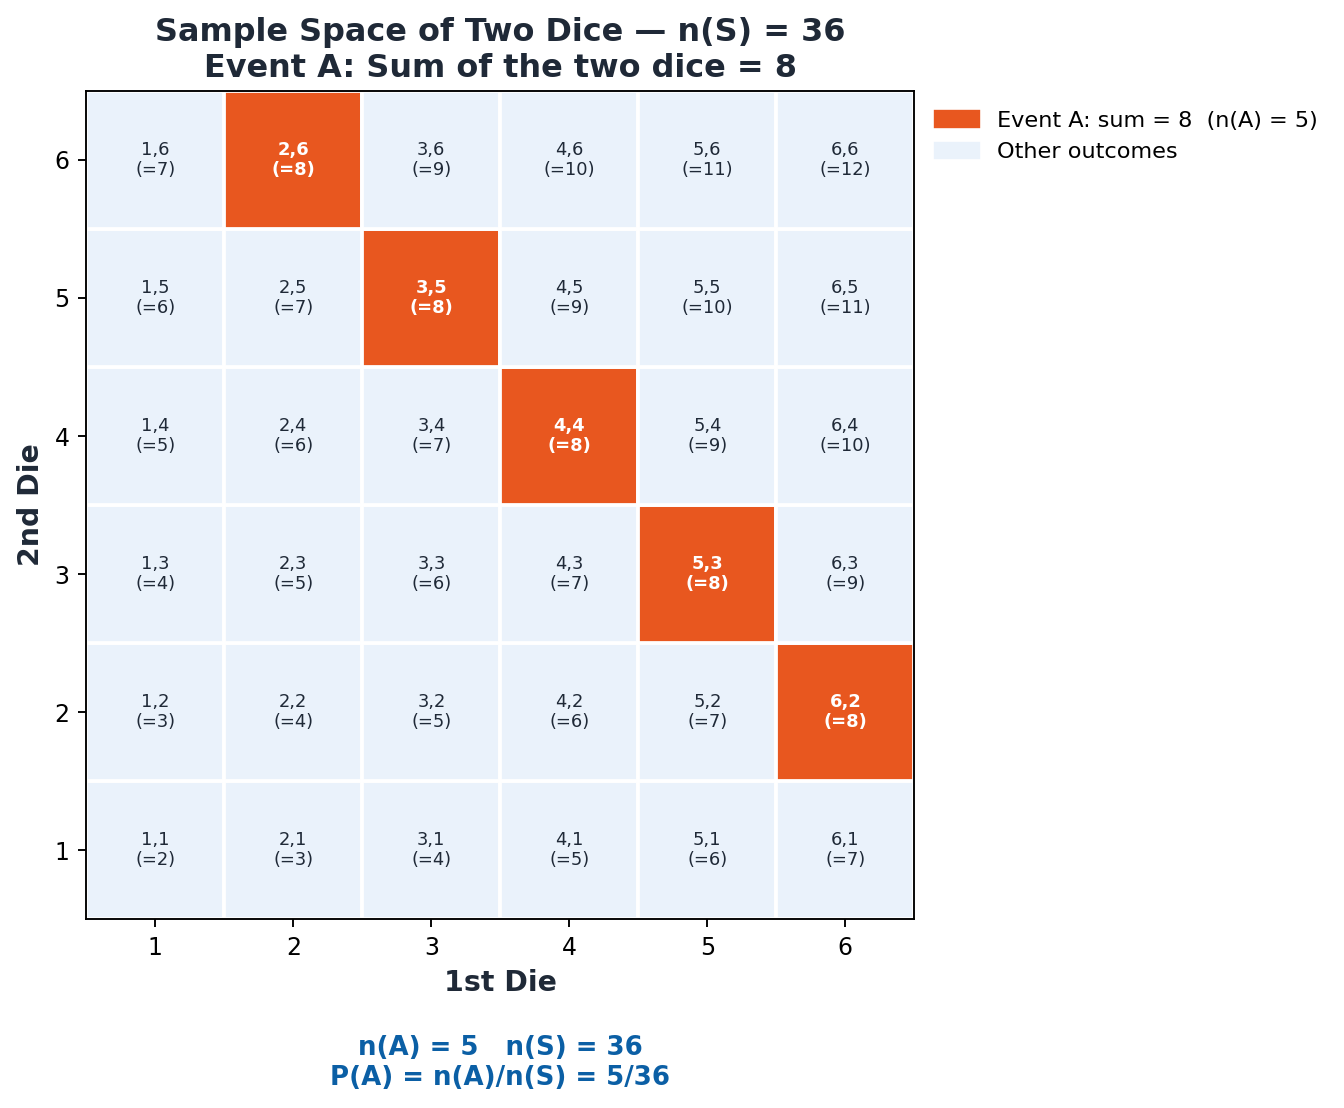
When two dice are rolled together, every outcome is an ordered pair (first die, second die), giving a sample space of n(S) = 6 x 6 = 36 equally likely outcomes, often displayed as a 6-by-6 grid. Events involving two dice are found the same way — by counting how many of the 36 pairs satisfy the event. For example, the event 'both dice show an even number' contains the pairs where both coordinates are from {2, 4, 6}, giving n(A) = 3 x 3 = 9 outcomes, so P(A) = 9/36 = 1/4; similarly, the event 'the sum of the two dice equals 8' contains the pairs (2,6), (3,5), (4,4), (5,3), (6,2), giving n(A) = 5, so P(A) = 5/36.
13.3 Probability of an Event Not Occurring
The complement of an event A, written A', is the event that A does NOT occur — it consists of every outcome in the sample space that is not in A. Since every outcome in S either belongs to A or to A' but never both, the two probabilities must add up to exactly 1: P(A) + P(A') = 1. Rearranging this relationship gives the complement rule, P(A') = 1 – P(A), which lets us find the probability of an event not happening directly from the probability of it happening, without recounting outcomes.
The complement rule is especially useful when the 'not occurring' event is easier to describe than a long list of favourable outcomes. For example, the probability of not getting a 6 on a single die is P(A') = 1 – P(6) = 1 – 1/6 = 5/6; the probability of not getting a double-six when two dice are thrown together is P(A') = 1 – 1/36 = 35/36, since only one of the 36 outcomes, (6,6), is a double six.
13.4 Real-Life Problems Involving Probability
Probability, together with the complement rule, is regularly used to analyse real-life situations that involve chance. For example, if a missile has a known probability of hitting a target, the probability of it missing the target is found using the complement rule; if a bag contains a known number of blue and green balls, the probability of drawing 'not green' can be found either by counting the blue balls directly or by subtracting P(green) from 1.
Playing cards provide another common real-life context: a standard deck has 52 cards divided into 4 suits (hearts, diamonds, clubs, spades) of 13 cards each. The probability of drawing a heart is P(heart) = 13/52 = 1/4, and since spades and hearts together make up 26 of the 52 cards, P(spade or heart) = 26/52 = 1/2; the complement rule then gives the probability of drawing neither a spade nor a heart as 1 – 1/2 = 1/2.
13.5 Relative Frequency as an Estimate of Probability
While the formula P(A) = n(A)/n(S) works well for simple experiments like dice and coins where every outcome is equally likely, many real-life situations involve recorded data instead — surveys, experiments repeated many times, or production records — where relative frequency is used as a practical estimate of probability. The relative frequency of an event is defined as Relative frequency = (frequency of the specific event) / (total frequency) = x/N, where x is how many times the event occurred and N is the total number of observations (Sum of f).
Relative frequency behaves like a probability: it always lies between 0 and 1, and when the relative frequencies of every category in a complete frequency distribution are added together, the sum is always approximately 1 (exactly 1 if no rounding has occurred). This makes relative frequency a natural bridge between recorded real-world data and the theoretical idea of probability — as the number of observations N grows very large, the relative frequency of an event approaches its true theoretical probability.
13.6 Expected Frequency and Its Real-Life Application
Expected frequency turns the idea of probability around: instead of using data to estimate a probability, it uses a known (or assumed) probability to predict how many times an event should occur in a given number of trials. The expected frequency of an event is calculated as Expected frequency = Total number of trials x Probability of the event = N x P(A). Just as the relative frequencies of a complete distribution sum to approximately 1, the expected frequencies of all the categories in a distribution sum to approximately N, the fixed total number of trials.
Expected frequency has wide real-life application wherever a known probability needs to be converted into a predicted count. For example, if a fair die is rolled 300 times, the expected number of times a 1 or a 6 appears is N x P(A) = 300 x (2/6) = 100; if a factory knows from experience that the probability of a manufactured bolt being defective is 0.3, then out of 800 bolts produced, the expected number of non-defective bolts is 800 x 0.7 = 560, information a quality-control team can use to plan inspection and replacement in advance.
Important Definitions
Experiment
Any process that generates a result or outcome, such as tossing a coin, rolling a die, or drawing a card from a deck.
Sample Space (S)
The set of all possible outcomes of an experiment; for a single die, S = {1, 2, 3, 4, 5, 6}, so n(S) = 6.
Sample Point
Each individual member (outcome) of a sample space; for example, the outcome '4' is one sample point in the sample space of a die.
Event
Any subset of the sample space — a collection of one or more outcomes that satisfy a particular condition of interest.
Favourable Outcome
An outcome of an experiment that matches or satisfies the particular event being considered.
Certain Event
An event that is sure to happen every time the experiment is performed, with probability P(A) = 1.
Impossible Event
An event that can never happen, no matter how many times the experiment is performed, with probability P(A) = 0.
Complement of an Event (A')
The event that A does NOT occur, consisting of every outcome in the sample space that is not in A; P(A') = 1 – P(A).
Relative Frequency
An estimate of probability calculated from recorded data as (frequency of the event) / (total frequency), written x/N.
Expected Frequency
The predicted number of times an event should occur in N trials, calculated as N x P(A); also called theoretical frequency.
Key Facts and Relations
| Topic | Key Fact / Relation |
|---|---|
| Probability of an Event | P(A) = n(A)/n(S), where n(A) = number of favourable outcomes, n(S) = total number of possible outcomes. |
| Range of Probability | 0 ≤ P(A) ≤ 1 for every event A; P(A) = 0 means impossible, P(A) = 1 means certain. |
| Complement Rule | P(A') = 1 – P(A), the probability of an event NOT occurring equals 1 minus the probability of it occurring. |
| Event and Its Complement | P(A) + P(A') = 1, since every outcome of S belongs either to A or to A', but never both. |
| Sample Space Size for n Dice | n(S) = 6^n when n fair dice are rolled together; for two dice, n(S) = 6^2 = 36. |
| Relative Frequency | Relative frequency = x/N, where x = frequency of the specific event, N = total frequency (Sum of f). |
| Sum of Relative Frequencies | The relative frequencies of every category in a complete distribution sum to approximately 1. |
| Expected Frequency | Expected frequency = N x P(A), where N = total number of trials and P(A) = probability of the event. |
| Sum of Expected Frequencies | The expected frequencies of every category in a distribution sum to approximately N, the fixed number of trials. |
Diagrams
Sample Space of Two Dice: A 6×6 grid showing all 36 equally likely outcomes of rolling two fair dice, with the cells where the sum of the two dice equals 8 highlighted in orange (n(A) = 5), illustrating how to count favourable outcomes for a two-dice event.
Probability of an Event and Its Complement: A two-panel figure: the left panel shows paired bars for three example events, each split into P(A) and P(A') segments that sum to 1; the right panel shows a 0-to-1 probability number line marking impossible, unlikely, equally likely, likely, and certain events.
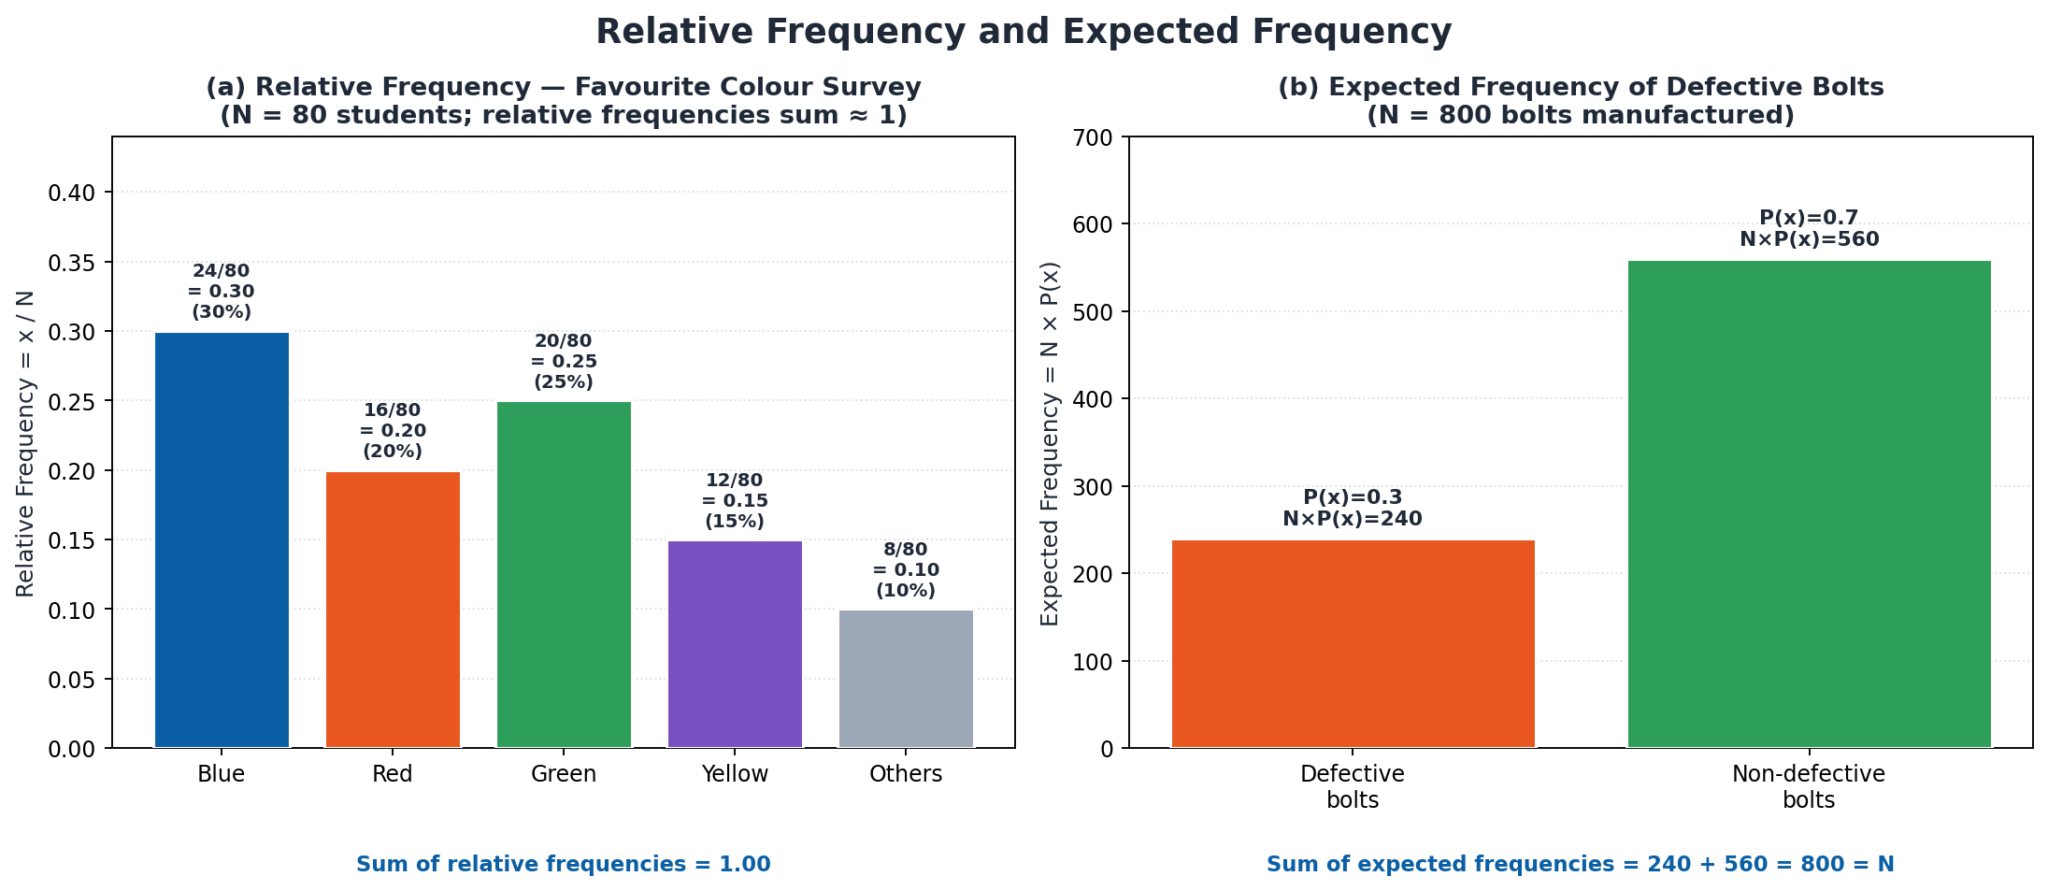
Relative Frequency and Expected Frequency: A two-panel figure: the left panel is a bar chart of relative frequencies from an 80-student favourite-colour survey, with percentage labels summing to approximately 1; the right panel compares given probabilities P(x) against expected frequencies N x P(x) for defective and non-defective bolts out of 800.
Solved Examples
Example 1: Probability of a Single Event on One Die
Problem: A fair die is rolled once. Find the probability of getting a number greater than 4.
- Write the sample space: S = {1, 2, 3, 4, 5, 6}, so n(S) = 6.
- Identify the favourable outcomes: numbers greater than 4 are A = {5, 6}, so n(A) = 2.
- Apply the formula: P(A) = n(A)/n(S) = 2/6 = 1/3.
- Check the range: since 0 ≤ 1/3 ≤ 1, the answer is a valid probability.
Example 2: Probability Using the Sample Space of Two Dice
Problem: Two fair dice are rolled together. Find the probability that the sum of the two numbers shown is 8.
- Write the sample space size: n(S) = 6 x 6 = 36 equally likely ordered pairs.
- List the favourable outcomes where the sum equals 8: (2,6), (3,5), (4,4), (5,3), (6,2).
- Count the favourable outcomes: n(A) = 5.
- Apply the formula: P(A) = n(A)/n(S) = 5/36.
Example 3: Complement of an Event — Not Getting a Six
Problem: A fair die is thrown once. Find the probability of NOT getting a 6.
- Find the probability of the original event: P(getting a 6) = n(A)/n(S) = 1/6.
- Apply the complement rule: P(not getting a 6) = 1 – P(A) = 1 – 1/6.
- Simplify: 1 – 1/6 = 6/6 – 1/6 = 5/6.
- Verify: P(A) + P(A') = 1/6 + 5/6 = 6/6 = 1, confirming the complement rule holds.
Example 4: Complement for Two Dice — No Double Six
Problem: Two fair dice are thrown together. Find the probability that they do NOT both show a 6 (i.e. not a double six).
- Write the sample space size: n(S) = 36.
- Identify the double-six outcome: only (6,6), so n(double six) = 1, giving P(double six) = 1/36.
- Apply the complement rule: P(not double six) = 1 – P(double six) = 1 – 1/36.
- Simplify: 1 – 1/36 = 36/36 – 1/36 = 35/36.
Example 5: Cards Probability with Complement
Problem: A card is drawn at random from a well-shuffled standard deck of 52 playing cards. Find the probability that it is a heart, and the probability that it is neither a spade nor a heart.
- Note the deck structure: 52 cards in 4 suits (hearts, diamonds, clubs, spades) of 13 cards each.
- Find P(heart): n(heart) = 13, so P(heart) = 13/52 = 1/4.
- Find P(spade or heart): spades and hearts together give n(A) = 13 + 13 = 26, so P(A) = 26/52 = 1/2.
- Apply the complement rule for 'neither spade nor heart': P(neither) = 1 – P(spade or heart) = 1 – 1/2 = 1/2.
Example 6: Relative Frequency from a Survey
Problem: In a survey of 80 students, favourite colour was recorded as: Blue 24, Red 16, Green 20, Yellow 12, Others 8. Find the relative frequency of each colour and confirm the relative frequencies sum to approximately 1.
- Note the total: N = Sum of f = 24 + 16 + 20 + 12 + 8 = 80 students.
- Compute each relative frequency as x/N: Blue = 24/80 = 0.30, Red = 16/80 = 0.20, Green = 20/80 = 0.25.
- Continue: Yellow = 12/80 = 0.15, Others = 8/80 = 0.10.
- Sum the relative frequencies: 0.30 + 0.20 + 0.25 + 0.15 + 0.10 = 1.00, confirming the sum is approximately 1.
Example 7: Expected Frequency of Getting a 1 or 6 in 300 Rolls
Problem: A fair die is rolled 300 times. Find the expected number of times a 1 or a 6 appears.
- Find the probability of the event: P(1 or 6) = n(A)/n(S) = 2/6 = 1/3.
- Note the total number of trials: N = 300.
- Apply the expected frequency formula: Expected frequency = N x P(A) = 300 x (1/3).
- Simplify: 300 x (1/3) = 100, so a 1 or a 6 is expected to appear about 100 times in 300 rolls.
Example 8: Expected Frequency of Defective Bolts
Problem: A factory finds from experience that the probability of a manufactured bolt being defective is 0.3. Out of 800 bolts produced, find the expected number of defective bolts and the expected number of non-defective bolts.
- Note the given probabilities: P(defective) = 0.3, so by the complement rule P(non-defective) = 1 – 0.3 = 0.7.
- Note the total number of trials: N = 800 bolts.
- Expected defective bolts = N x P(defective) = 800 x 0.3 = 240.
- Expected non-defective bolts = N x P(non-defective) = 800 x 0.7 = 560; check: 240 + 560 = 800 = N.
Short Questions & Answers
What is a sample space? Give an example.
A sample space is the set of all possible outcomes of an experiment. For example, when a single die is rolled, the sample space is S = {1, 2, 3, 4, 5, 6}, so n(S) = 6.
What is the difference between an outcome and a favourable outcome?
An outcome is any single result produced by an experiment, while a favourable outcome is specifically an outcome that matches the event we are interested in. For example, when rolling a die for the event 'even number', all six numbers are outcomes, but only 2, 4, and 6 are favourable outcomes.
What is the complement of an event, and what formula is used to find its probability?
The complement of an event A, written A', is the event that A does not occur, consisting of every outcome in the sample space not included in A. Its probability is found using the complement rule, P(A') = 1 – P(A).
Why must the sum of relative frequencies in a complete distribution be approximately 1?
Relative frequency is defined as x/N for each category, where x is the frequency of that category and N is the total frequency of all categories combined. Adding every category's relative frequency together gives (Sum of x)/N = N/N = 1, since the sum of all the individual frequencies equals the total N.
What is expected frequency, and what formula is used to calculate it?
Expected frequency is the predicted number of times an event should occur in a given number of trials, based on its known probability. It is calculated as Expected frequency = N x P(A), where N is the total number of trials and P(A) is the probability of the event.
Give one example each of a certain event and an impossible event.
A certain event is one that is sure to happen, such as getting a number between 1 and 6 when rolling an ordinary die, which has probability P(A) = 1. An impossible event can never happen, such as getting a 7 on an ordinary six-sided die, which has probability P(A) = 0.
How does the sample space of two dice rolled together differ from that of a single die?
A single die has a sample space of S = {1, 2, 3, 4, 5, 6}, so n(S) = 6. When two dice are rolled together, every outcome is an ordered pair of results, giving a sample space of n(S) = 6 x 6 = 36 equally likely outcomes.
What is the difference between theoretical probability and relative frequency?
Theoretical probability is calculated in advance using P(A) = n(A)/n(S), assuming every outcome in the sample space is equally likely, such as with a fair die or coin. Relative frequency, x/N, is instead calculated from actually recorded data after an experiment or survey has been carried out, and is used as a practical estimate of probability when outcomes are not known to be equally likely in advance.
Long Questions & Answers
Explain the basic concepts of probability and how the probability of a single event and its complement are calculated.
What is an experiment, sample space, and event in probability?
An experiment is any process that generates a result, such as tossing a coin or rolling a die. The sample space S is the set of all possible outcomes of that experiment — for a single die, S = {1, 2, 3, 4, 5, 6}, so n(S) = 6 — and each individual outcome within it is called a sample point. An event is any subset of the sample space representing a particular condition of interest, such as A = {2, 4, 6} for 'an even number appears' on a die, giving n(A) = 3.
What is the formula for the probability of an event, and what are its lower and upper limits?
The probability of an event A is given by P(A) = n(A)/n(S), where n(A) is the number of favourable outcomes and n(S) is the total number of possible outcomes in the sample space. This ratio always lies between 0 and 1, written 0 ≤ P(A) ≤ 1, because the number of favourable outcomes can never be negative and can never exceed the total number of outcomes. A probability closer to 0 indicates the event is unlikely, while a probability closer to 1 indicates it is likely.
What are certain, impossible, likely, unlikely, and equally likely events?
A certain event is one that is sure to occur every time the experiment is performed, with P(A) = 1, such as getting a number from 1 to 6 on an ordinary die. An impossible event can never occur, with P(A) = 0, such as getting a 7 on that same die. Between these extremes, an event with probability greater than 0.5 is called likely, one with probability less than 0.5 is called unlikely, and one with probability exactly 0.5 is called equally likely, such as getting heads on a single fair coin toss.
How is the complement of an event calculated, and what real-life problems use it?
The complement of an event A, written A', is the event that A does not happen, and it is calculated using the complement rule P(A') = 1 – P(A), since P(A) + P(A') always equals 1. This is useful in real life whenever the 'not occurring' case is easier to work with than listing every favourable outcome directly — for example, finding the probability that a missile misses a target given its probability of hitting it, or finding the probability of drawing neither a spade nor a heart from a deck of cards by subtracting P(spade or heart) from 1.
Explain relative frequency and expected frequency as estimates of probability, including their real-life applications.
What is relative frequency, and how does it differ from theoretical probability?
Relative frequency is an estimate of probability calculated from actual recorded data, defined as Relative frequency = x/N, where x is how many times a specific event occurred and N is the total number of observations. It differs from theoretical probability, P(A) = n(A)/n(S), which is calculated in advance assuming every outcome in a sample space is equally likely (as with a fair die or coin); relative frequency instead reflects what was actually observed in a survey, experiment, or set of records, and does not require the outcomes to be equally likely beforehand.
How is relative frequency calculated from a frequency table, and what should the relative frequencies sum to?
To calculate relative frequency from a frequency table, first find the total frequency N by adding up the frequencies of every category (N = Sum of f), then divide each individual category's frequency x by this total to get x/N for that category. When every category's relative frequency is added together, the sum should always come out to approximately 1 (exactly 1 without rounding), since the individual frequencies themselves add up to the total N.
What is expected frequency, and how is it calculated?
Expected frequency is the number of times an event is predicted to occur in a given number of trials, based on its known or assumed probability. It is calculated using Expected frequency = N x P(A), where N is the total number of trials and P(A) is the probability of the event; just like relative frequencies sum to approximately 1, the expected frequencies of every category in a distribution sum to approximately N, the fixed total number of trials.
What real-life applications use relative frequency and expected frequency?
Relative frequency is commonly used to summarise survey results, such as finding what proportion of students prefer each of several favourite colours out of a sample of 80 students. Expected frequency is used to turn a known probability into a practical prediction, such as calculating that a fair die rolled 300 times should show a 1 or a 6 about 100 times, or that a factory producing 800 bolts with a 0.3 probability of a defect should expect about 240 defective and 560 non-defective bolts, information used for planning quality control and inspection.
Multiple Choice Questions (MCQs)
Each individual member of a sample space is called a: (A) Event (B) Sample point (C) Favourable outcome (D) Frequency
Correct answer: (B) Sample point. Each individual outcome that belongs to a sample space is called a sample point.
An outcome that matches the particular result we are interested in is called a: (A) Sample space (B) Complement (C) Favourable outcome (D) Experiment
Correct answer: (C) Favourable outcome. A favourable outcome is an outcome of an experiment that satisfies the event under consideration.
Relative frequency is defined as: (A) n(A)/n(S) (B) N x P(A) (C) x/N (frequency of the event / total frequency) (D) 1 – P(A)
Correct answer: (C) x/N (frequency of the event / total frequency). Relative frequency is calculated from recorded data as the frequency of the specific event divided by the total frequency, x/N.
Expected frequency is also known as: (A) Relative frequency (B) Theoretical frequency (C) Class frequency (D) Complement frequency
Correct answer: (B) Theoretical frequency. Expected frequency, calculated as N x P(A), is also called theoretical frequency because it is the number of occurrences predicted by probability theory.
The sum of the expected frequencies of all categories in a distribution is approximately equal to: (A) 1 (B) 0.5 (C) The fixed total number of trials, N (D) The probability of a single event
Correct answer: (C) The fixed total number of trials, N. Since expected frequency = N x P(A) for each category, and the probabilities sum to 1, the expected frequencies sum to approximately N, the total number of trials.
The probability of an event A is defined as: (A) P(A) = n(S)/n(A) (B) P(A) = n(A) + n(S) (C) P(A) = n(A)/n(S) (D) P(A) = n(A) x n(S)
Correct answer: (C) P(A) = n(A)/n(S). Probability is defined as the number of favourable outcomes n(A) divided by the total number of possible outcomes n(S).
An event whose probability is greater than 0.5 is called a: (A) Certain event (B) Impossible event (C) Likely event (D) Equally likely event
Correct answer: (C) Likely event. An event with a probability greater than 0.5 is described as a likely event, since it is more likely to occur than not.
If n fair dice are rolled together, the size of the sample space is: (A) 6n (B) n^6 (C) 6^n (D) 6 + n
Correct answer: (C) 6^n. Each die has 6 equally likely outcomes, so for n dice rolled together the sample space size is 6^n, e.g. 6^2 = 36 for two dice.
Two fair dice are rolled together. The probability that both dice show a 2 is: (A) 1/6 (B) 1/12 (C) 1/36 (D) 2/36
Correct answer: (C) 1/36. Only one outcome out of 36, namely (2,2), gives a double two, so the probability is 1/36.
A card is drawn from a standard 52-card deck. The probability that it is NOT a jack and NOT a king is: (A) 8/52 (B) 44/52 (C) 4/52 (D) 48/52
Correct answer: (B) 44/52. There are 4 jacks and 4 kings, 8 cards in total to exclude, leaving 52 – 8 = 44 favourable cards, so the probability is 44/52.
Quick Revision Summary
- Probability P(A) = n(A)/n(S), where n(A) = favourable outcomes and n(S) = total possible outcomes in the sample space.
- Every probability satisfies 0 ≤ P(A) ≤ 1; P(A) = 0 is an impossible event, P(A) = 1 is a certain event.
- A sample space S is the set of all possible outcomes; each outcome in S is a sample point; an event is any subset of S.
- For a single die n(S) = 6; for two dice rolled together n(S) = 6 x 6 = 36; in general, for n dice n(S) = 6^n.
- The complement rule states P(A') = 1 – P(A), and P(A) + P(A') = 1, since every outcome is either in A or in A' but not both.
- A standard deck has 52 cards, 4 suits of 13 cards each, so P(any single suit) = 13/52 = 1/4.
- Relative frequency = x/N estimates probability from recorded data; the relative frequencies of a complete distribution sum to approximately 1.
- Expected frequency = N x P(A) predicts how often an event should occur in N trials; expected frequencies of a distribution sum to approximately N.
- Likely events have P(A) > 0.5, unlikely events have P(A) < 0.5, and equally likely events have P(A) = 0.5.
- Probability, relative frequency, and expected frequency are used in real life for target/risk problems, surveys, and quality-control forecasting.
Exam Tips
- Always write out the sample space S (or at least count n(S)) before trying to count favourable outcomes — it prevents careless mistakes.
- For two-dice problems, sketching the 6×6 grid of outcomes makes it much easier to count favourable outcomes accurately than trying to list them from memory.
- When an event is described as 'not' something, check whether the complement rule P(A') = 1 – P(A) is faster than counting favourable outcomes directly.
- Always simplify your final probability fraction, and sanity-check that it lies between 0 and 1.
- When using relative frequency, add up all the relative frequencies at the end — they should total approximately 1; if not, recheck your arithmetic.
- For expected frequency problems, always check that the expected frequencies of every category sum back to the given total number of trials, N.