This chapter covers Spreadsheet Software from the 1st Year (ICS Part-I) Computer Science syllabus of the Punjab Curriculum and Textbook Board (PTB/PCTB). It explains what a spreadsheet is, cells, rows and columns, the types of data, formulas and functions, formatting, charts and the uses of spreadsheets. These notes are prepared by freebooks.pk.
A spreadsheet is a powerful tool for working with numbers. This chapter explains how it organises data in a grid and performs calculations automatically, which is why it is used in business, science and daily life.
Learning Objectives
- Define a spreadsheet and a worksheet.
- Describe cells, rows, columns and cell references.
- Identify the types of data entered in a cell.
- Use formulas and functions to perform calculations.
- Describe formatting and charts in a spreadsheet.
- State the uses of spreadsheet software.
Key Concepts
Spreadsheet and Worksheet
A spreadsheet is application software used to organise data, mainly numbers, in the form of a grid and to perform calculations on it automatically. Popular spreadsheet programs include Microsoft Excel. The working area is called a worksheet, which is a large grid of rows and columns; a file may contain several worksheets, and the whole file is called a workbook.
Cells, Rows and Columns
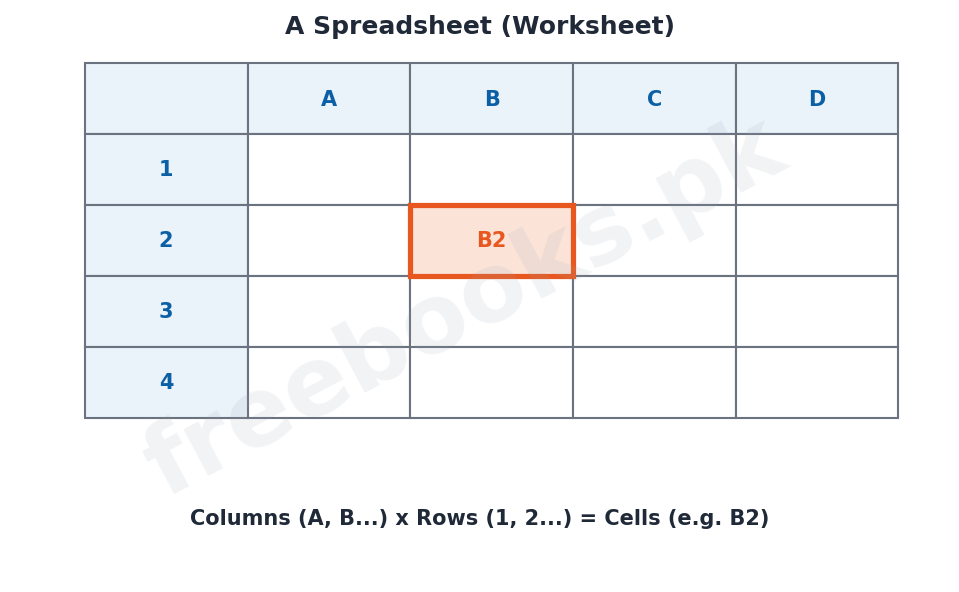
A worksheet is divided into columns, which run down the screen and are labelled with letters (A, B, C …), and rows, which run across the screen and are labelled with numbers (1, 2, 3 …). The box where a column and a row meet is called a cell, and it is the basic unit in which data is stored. Each cell has a unique cell reference (or cell address) made from its column letter and row number, such as B2, which identifies its position exactly.
Types of Data in a Cell
A cell can hold three kinds of data. A label (or text) is words used for headings and names, such as ‘Marks’. A value is a number that can be used in calculations, such as 80. A formula is an instruction, beginning with an equals sign, that tells the spreadsheet to calculate a result, such as =B2+B3. The spreadsheet automatically shows the result of a formula in the cell.
Formulas and Functions
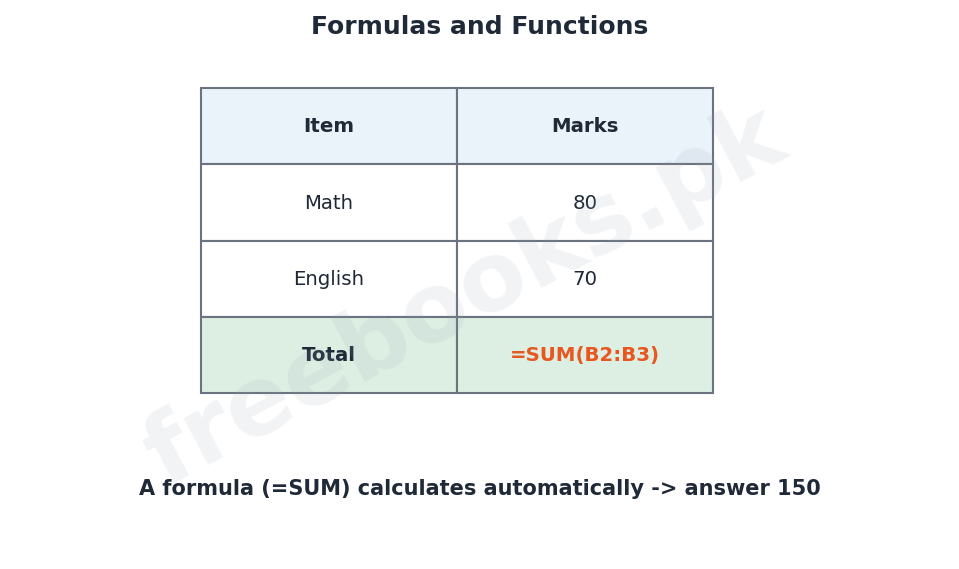
The great power of a spreadsheet comes from formulas, which perform calculations using the values in other cells. A formula always starts with an equals sign and can use cell references and the arithmetic operators + – * /. A function is a ready-made formula for a common calculation; for example, =SUM(B2:B5) adds a range of cells and =AVERAGE(B2:B5) finds their average. Because formulas use cell references, if a value is changed the results are recalculated automatically.
Formatting and Charts
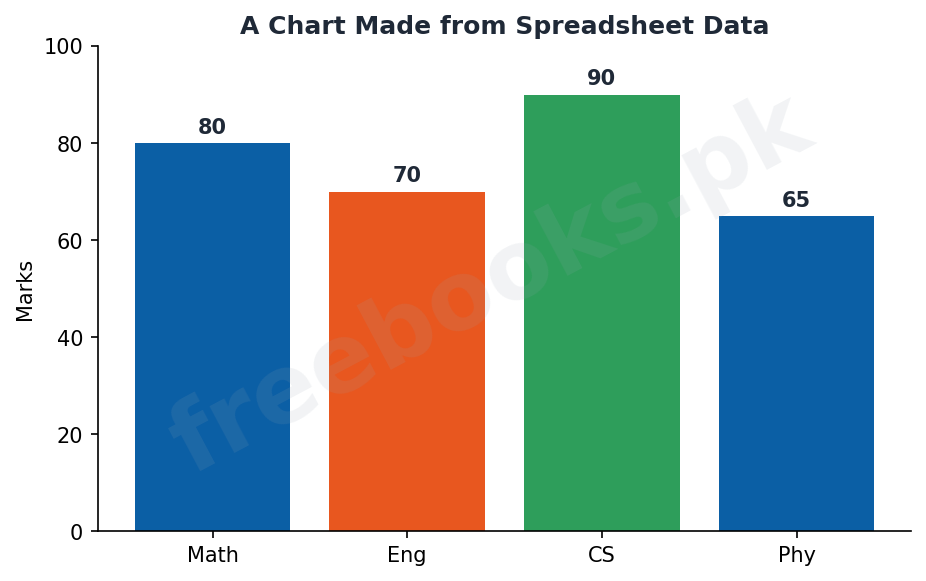
Like a word processor, a spreadsheet can format its data to make it clear: the font, size, colour, alignment and number format (such as currency or decimal places) of cells can be changed, and borders and shading added. A very useful feature is the ability to draw charts and graphs, such as bar charts, line graphs and pie charts, from the data in the cells, which show the information visually and make trends and comparisons easy to see.
Automatic Recalculation
One of the most valuable features of a spreadsheet is automatic recalculation. Because formulas refer to cells rather than to fixed numbers, whenever the contents of a cell are changed, every formula that depends on that cell is worked out again instantly. This makes it easy to try out different figures and see the effect at once, which is why spreadsheets are so useful for ‘what-if’ calculations such as budgets and forecasts.
Uses of Spreadsheets
Spreadsheets are used wherever numbers must be stored and calculated. Common uses include keeping accounts and budgets, preparing bills and payrolls, recording and analysing students’ marks, maintaining inventories, and producing charts and reports. Their ability to calculate automatically, recalculate when data changes, and present data as charts makes them one of the most widely used kinds of application software.
Important Definitions
Spreadsheet
Software that organises data in a grid and calculates automatically.
Worksheet
The grid of rows and columns in which data is entered.
Cell
The box where a row and a column meet; the basic unit of a worksheet.
Cell reference
The address of a cell made from its column letter and row number (e.g. B2).
Label
Text data used for headings and names.
Value
A number that can be used in calculations.
Formula
An instruction beginning with = that calculates a result.
Function
A ready-made formula such as SUM or AVERAGE.
Key Facts & Rules
| Item | Detail |
|---|---|
| Cell reference | Column letter + row number (e.g. B2) |
| Formula | Starts with = (e.g. =B2+B3) |
| SUM | =SUM(B2:B5) adds a range of cells |
| AVERAGE | =AVERAGE(B2:B5) finds the mean |
| Operators | + – * / |
| Recalculation | Formulas update automatically when data changes |
Diagrams & Illustrations
A spreadsheet grid: a worksheet with lettered columns and numbered rows, with the cell B2 highlighted to show a cell reference.
Formulas and functions: a small table where a =SUM formula adds two marks and shows the total automatically.
A chart from data: a bar chart drawn from spreadsheet data showing the marks in several subjects.
Solved Examples & Practice
Write a cell reference
The cell in column C and row 4 has the reference C4.
Add with a function
To add the numbers in cells B2 to B5, use the formula =SUM(B2:B5).
Find an average
To find the average of B2 to B5, use =AVERAGE(B2:B5).
Automatic recalculation
If B2 is changed from 80 to 90, any formula using B2 (such as a total) updates by itself at once.
Short Questions & Answers
What is a spreadsheet?
Application software that organises data in a grid of rows and columns and performs calculations automatically (e.g. MS Excel).
What is a cell?
The box where a row and a column meet; it is the basic unit in which data is stored, with a reference like B2.
Name the three types of data in a cell.
A label (text), a value (number) and a formula.
What is a formula?
An instruction that begins with an equals sign and tells the spreadsheet to calculate a result, such as =B2+B3.
What is the SUM function?
A ready-made function that adds the values in a range of cells, for example =SUM(B2:B5).
Why is automatic recalculation useful?
Because when a value is changed, all formulas that use it are worked out again instantly, without retyping them.
Long Questions & Answers
Q1: Describe the structure of a spreadsheet, including cells, rows, columns and cell references, and the types of data a cell can hold.
A spreadsheet is application software used to store data, chiefly numbers, in a grid and to carry out calculations on it automatically; a well-known example is Microsoft Excel. The area in which the user works is called a worksheet, and it is a large grid divided into columns and rows. The columns run vertically down the screen and are labelled with letters, A, B, C and so on, while the rows run horizontally across the screen and are labelled with numbers, 1, 2, 3 and so on. The small rectangular box formed where a particular column crosses a particular row is called a cell, and it is the basic unit of the worksheet in which a single item of data is stored. Every cell has its own unique cell reference, also called a cell address, which is made up of the letter of its column followed by the number of its row; for example, the cell in column B and row 2 has the reference B2, and this reference identifies the cell’s exact position so that it can be used in calculations. Each cell may contain one of three kinds of data. A label, or text, is words such as a heading or a name, for example ‘Marks’ or ‘English’; labels cannot be used in calculations. A value is a number, such as 80, which can be used in calculations. A formula is an instruction, which always begins with an equals sign, that tells the spreadsheet to calculate a result using the contents of other cells, for example =B2+B3; the spreadsheet works out the formula and displays the answer in the cell. This orderly structure of labelled cells is what allows a spreadsheet to organise data neatly and to calculate on it.
Q2: Explain formulas, functions and automatic recalculation in a spreadsheet.
The real power of a spreadsheet comes from its ability to perform calculations by means of formulas. A formula is an instruction entered into a cell that begins with an equals sign and tells the spreadsheet how to calculate a value; it can contain numbers, cell references and the arithmetic operators plus (+), minus (-), multiply (*) and divide (/). For example, the formula =B2+B3 adds the contents of cells B2 and B3, and =B2*C2 multiplies them. The key point is that a formula normally refers to other cells rather than to fixed numbers, so it always uses whatever values those cells currently hold. For common calculations, the spreadsheet provides ready-made formulas called functions, which save the user from writing long formulas; for instance, =SUM(B2:B5) adds up all the values in the range of cells from B2 to B5, and =AVERAGE(B2:B5) finds their average, while other functions find the largest, smallest or count of the values. Because formulas and functions work on cell references, spreadsheets offer an extremely useful feature called automatic recalculation: whenever the number in any cell is changed, every formula that depends on that cell is instantly recalculated and its result updated on the screen, without the user having to do anything. This makes it very easy to explore ‘what-if’ situations, such as seeing how a total changes when one figure is altered, and it is the reason spreadsheets are so valuable for budgets, accounts and forecasts.
Q3: Describe formatting and charts in a spreadsheet and state the main uses of spreadsheet software.
As well as calculating, a spreadsheet lets the user improve the appearance and usefulness of the data. Through formatting, the font, size, colour and alignment of the text and numbers in cells can be changed, borders and shading can be added to make tables clear, and numbers can be shown in particular formats such as currency, percentages or with a fixed number of decimal places. A particularly valuable feature is the ability to turn the numbers in the worksheet into charts and graphs. From the data in selected cells, the spreadsheet can automatically draw bar charts, line graphs, pie charts and other types of chart, which present the information visually so that trends, patterns and comparisons can be seen at a glance far more easily than from a table of figures; and because the chart is linked to the data, it changes automatically when the data changes. These abilities make spreadsheets useful in a very wide range of situations wherever numbers must be recorded and worked out. They are used for keeping accounts and preparing budgets, for calculating bills and payrolls, for recording and analysing students’ examination marks, for maintaining lists of stock or inventory, and for producing statistical reports and charts. Their combination of neat storage, automatic and instantly updated calculation, and clear visual presentation is why spreadsheet software is one of the most widely used of all application programs, in business, science, education and the home.
MCQs with Answers
Software that organises data in a grid and calculates is a: (a) word processor (b) spreadsheet (c) browser (d) database only
Correct Answer: (b) spreadsheet.
The grid where data is entered is called a: (a) desktop (b) worksheet (c) clipboard (d) toolbar
Correct Answer: (b) worksheet.
The box where a row and column meet is a: (a) cell (b) label (c) chart (d) file
Correct Answer: (a) cell.
Columns are usually labelled with: (a) numbers (b) letters (c) symbols (d) colours
Correct Answer: (b) letters.
The address B2 is an example of a: (a) formula (b) cell reference (c) function (d) label
Correct Answer: (b) cell reference.
A formula always begins with: (a) a letter (b) an equals sign (c) a number (d) a space
Correct Answer: (b) an equals sign.
=SUM(B2:B5) will: (a) subtract (b) add the range (c) average (d) count only
Correct Answer: (b) add the values in the range.
Text used for a heading is a: (a) value (b) label (c) formula (d) chart
Correct Answer: (b) label.
When a value changes, formulas are: (a) deleted (b) recalculated automatically (c) unchanged (d) printed
Correct Answer: (b) recalculated automatically.
A bar chart drawn from data is a: (a) cell (b) formula (c) chart (d) label
Correct Answer: (c) chart.
Quick Revision Summary
- Spreadsheet = software organising data in a grid + auto calculation (e.g. Excel); worksheet = the grid.
- Columns (letters) x rows (numbers) = cells; cell reference like B2.
- Cell data: label (text), value (number), formula (starts with =).
- Functions: =SUM(range), =AVERAGE(range); operators + – * /.
- Formatting + charts (bar/line/pie); automatic recalculation when data changes.
- Uses: accounts, budgets, payroll, marks, inventory, reports. Notes by freebooks.pk.
Exam Tips
- Define spreadsheet, worksheet and cell.
- Explain a cell reference (column letter + row number).
- List the three types of cell data.
- Write a formula and a function (=SUM, =AVERAGE).
- State why automatic recalculation is useful.
- Give real uses of spreadsheets.