This chapter covers Microsoft Access Forms and Reports from the 2nd Year (ICS Part-II) Computer Science syllabus of the Punjab Curriculum and Textbook Board (PTB/PCTB). It explains forms and how they are created, form controls, reports and their sections, and grouping, sorting and totals in reports. These notes are prepared by freebooks.pk.
Forms make entering data easy and reports make printing it neat. This chapter explains these two Access objects that turn a database into a friendly, usable application.
Learning Objectives
- Explain the purpose of a form.
- Describe how a form is created.
- Identify common form controls.
- Explain the purpose of a report.
- Describe the sections of a report.
- Explain grouping, sorting and totals in reports.
Key Concepts
What is a Form?
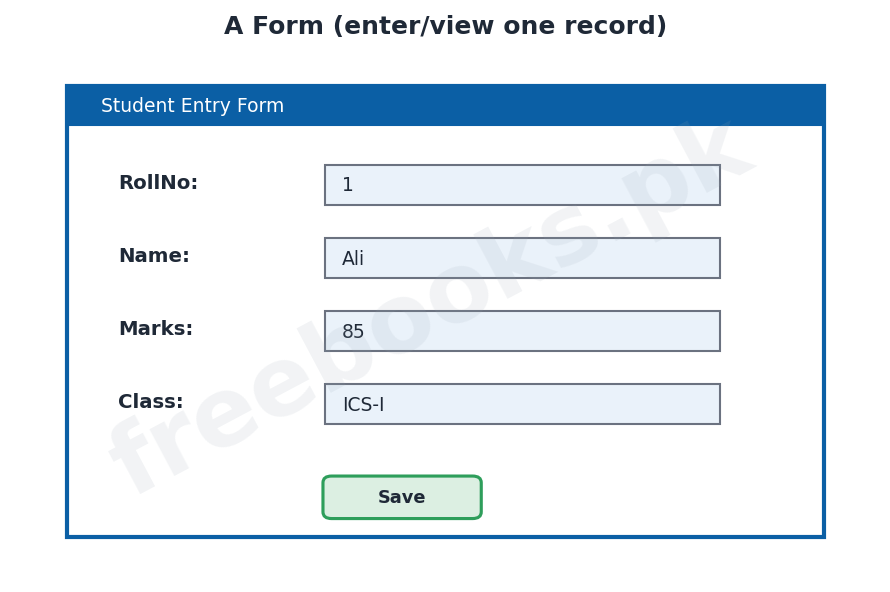
A form is an Access object that provides an attractive, easy-to-use screen for working with the data in a table, usually showing one record at a time. Forms make entering, viewing and editing data far more convenient and less error-prone than typing directly into a datasheet, because each field is clearly labelled and laid out. Forms are the main way ordinary users interact with a database.
Creating a Form
A form can be created in two main ways. The Form Wizard asks the user a few questions, such as which table and which fields to include, and then builds the form automatically, which is quick and easy. Alternatively the form can be built in Design View, where the user places and arranges the controls by hand for full control over the layout. A form is based on a table or a query, which supplies the data it shows.
Form Controls
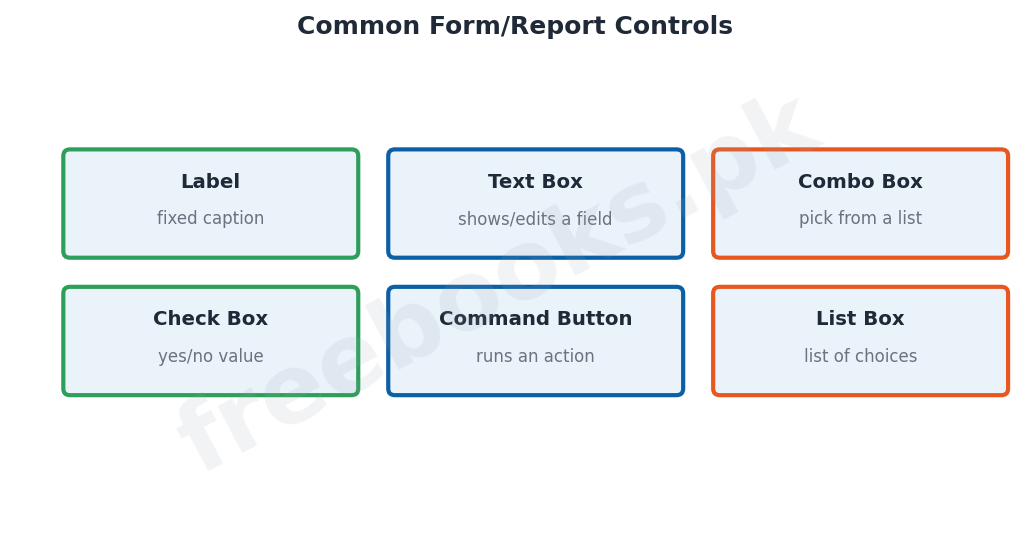
The items placed on a form (or report) are called controls. Common controls include the label, which displays fixed text such as a caption; the text box, which shows and lets the user edit the value of a field; the combo box and list box, which let the user choose a value from a list; the check box, for yes/no values; and the command button, which performs an action such as saving a record or moving to the next one when it is clicked. Controls are what make a form interactive.
What is a Report?
A report is an Access object designed to present data in a neatly formatted way for printing on paper. Unlike a form, which is meant for working with data on screen, a report is meant for output; it takes its data from a table or a query and arranges it with headings, groupings, totals and page numbers to produce professional printed documents such as mark sheets, bills and lists. Reports are read-only, so they cannot be used to change the data.
Creating a Report and Its Sections
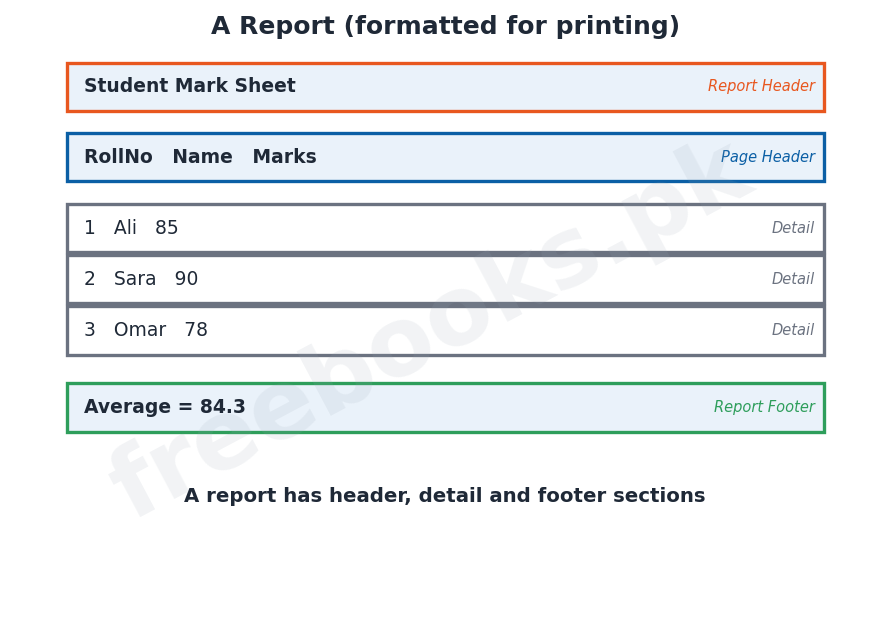
Like a form, a report can be created quickly with the Report Wizard or built by hand in Design View. A report is divided into sections. The report header appears once at the very start (for the title); the page header appears at the top of every page (for column headings); the detail section prints once for each record and forms the body of the report; the page footer appears at the bottom of every page (for the page number); and the report footer appears once at the very end (for grand totals). These sections give the report its structure.
Grouping and Sorting in Reports
A report can group its records so that related records are printed together under a heading; for example, students can be grouped by class, with each class starting a new group. Within and between groups the records can be sorted into order, such as by name or by marks. Grouping and sorting make a long report easier to read by organising the data logically.
Calculations and Totals
A report can also perform calculations on its data. Using functions such as SUM, AVERAGE, COUNT, MAX and MIN placed in the group footer or report footer, a report can print subtotals for each group and grand totals for the whole report, for example the total marks of each class and the overall average. These automatic calculations make reports very useful for summarising data.
Important Definitions
Form
An object providing a screen layout to enter, view and edit data.
Form Wizard
A tool that builds a form automatically from a table or query.
Control
An item placed on a form or report (label, text box, button, etc.).
Text box
A control that shows and edits the value of a field.
Command button
A control that performs an action when clicked.
Report
An object that presents data in a formatted way for printing.
Detail section
The report section that prints once for each record.
Grouping
Printing related records together under a heading in a report.
Key Facts & Rules
| Item | Detail |
|---|---|
| Form | Enter/view data, one record at a time |
| Create a form | Form Wizard or Design View (based on table/query) |
| Controls | Label, text box, combo/list box, check box, command button |
| Report | Formatted output for printing (read-only) |
| Report sections | Report header, page header, detail, page footer, report footer |
| Report totals | SUM, AVERAGE, COUNT in group/report footer |
Diagrams & Illustrations
A form: a data entry form showing labelled fields and a Save button for one record.
A report: a report with its header, detail and footer sections producing a printed mark sheet with an average.
Form controls: common controls used on forms and reports: label, text box, combo box, check box, command button and list box.
Solved Examples & Practice
Choose the object
To let a clerk type in new students easily, make a form; to print the class result, make a report.
Pick a control
To let the user choose a class from a fixed list on a form, use a combo box.
Report section
Column headings such as ‘Name’ and ‘Marks’ are placed in the page header of a report.
Add a total
To print the average marks of a class, put an AVERAGE calculation in the report (group) footer.
Short Questions & Answers
What is a form?
An Access object that provides an easy screen layout to enter, view and edit data, usually one record at a time.
Name two ways to create a form.
Using the Form Wizard or building it by hand in Design View.
What is a control? Give two examples.
An item placed on a form or report, such as a text box (shows/edits a field) and a command button (runs an action).
What is a report used for?
To present data in a neatly formatted way for printing, such as a mark sheet; it is read-only.
Name the section of a report that prints once per record.
The detail section.
What is grouping in a report?
Printing related records together under a heading, for example grouping students by class.
Long Questions & Answers
Q1: Explain what a form is, how it is created, and the common controls used on it.
A form is one of the objects of a Microsoft Access database, and its purpose is to provide a convenient, attractive screen through which users can work with the data held in a table. Instead of typing into a plain datasheet, the user sees a form that usually displays one record at a time, with each field clearly labelled and laid out, which makes entering new data, and viewing or editing existing data, much easier and far less likely to cause mistakes. For this reason the form is the main way in which ordinary users interact with a database. A form can be created in two main ways. The quickest is to use the Form Wizard, which asks the user a few simple questions, such as which table or query the form should be based on and which fields it should contain, and then builds a complete form automatically. For more control over the appearance, the user can instead build the form by hand in Design View, placing and arranging each item exactly as wanted. Whichever method is used, the form is based on a table or a query, which supplies the data that appears in it. The items that are placed on a form are called controls, and several kinds are commonly used. A label displays fixed text, such as the caption beside a field. A text box shows the value of a field and lets the user edit it, and is the most common control. A combo box or a list box lets the user pick a value from a list rather than typing it. A check box is used for a yes/no value. A command button carries out an action, such as saving the record or moving to the next one, when it is clicked. Together these controls turn a form into an interactive screen for working comfortably with the data.
Q2: Explain what a report is and describe the sections of a report.
A report is the Access object that is designed to present the data of a database in a neat, well-organised way for printing on paper. Whereas a form is intended for working with data interactively on the screen, a report is intended for output; it takes its data from a table or a query and lays it out attractively, with titles, headings, groupings, totals and page numbers, so as to produce professional printed documents such as mark sheets, bills, invoices and lists. Because reports are meant only for output, they are read-only and cannot be used to change the stored data. A report can be created quickly using the Report Wizard, which builds it automatically after asking which data to include, or it can be constructed by hand in Design View for complete control over the layout. Every report is divided into a number of sections, each of which prints at a particular place. The report header appears just once, at the very beginning of the report, and is used for the overall title. The page header appears at the top of every page and is normally used for the column headings, such as ‘Name’ and ‘Marks’. The detail section is the main body of the report; it is printed once for every record in the underlying data, so it is here that the individual records appear. The page footer appears at the bottom of every page and typically holds the page number or the date. Finally, the report footer appears once, at the very end of the report, and is used for grand totals or concluding information. By arranging the data into these sections, a report gives its printed output a clear and consistent structure.
Q3: Describe grouping, sorting and calculations (totals) in an Access report.
Beyond simply listing records, an Access report offers powerful features for organising and summarising data, namely grouping, sorting and calculations. Grouping means arranging the records so that those that belong together are printed together under a common heading; for example, in a report of examination results, the students can be grouped by their class, so that all the students of one class appear together beneath that class name before the next class begins. Grouping makes a long report much easier to read, because the data is broken up into meaningful sections instead of one continuous list. Within the report, and within each group, the records can also be sorted, that is, arranged into a chosen order, such as alphabetical order of name or descending order of marks, so that the reader can find information easily. In addition, a report can carry out calculations on its data by means of built-in functions such as SUM, which adds values, AVERAGE, which finds the mean, COUNT, which counts records, and MAX and MIN, which find the largest and smallest values. When such a calculation is placed in the footer of a group, it produces a subtotal for that group, for instance the total or average marks of each class; when it is placed in the report footer, it produces a grand total for the whole report, such as the overall average of all students. Through grouping, sorting and these automatic totals, a report can not only display the data but also summarise it clearly, which is what makes reports so useful for presenting the information stored in a database.
MCQs with Answers
The object used to enter data one record at a time is the: (a) report (b) form (c) query (d) table
Correct Answer: (b) form.
A quick way to build a form is the: (a) Report Wizard (b) Form Wizard (c) query (d) macro
Correct Answer: (b) Form Wizard.
An item placed on a form is a: (a) control (b) field (c) record (d) key
Correct Answer: (a) control.
The control that shows and edits a field is the: (a) label (b) text box (c) line (d) image
Correct Answer: (b) text box.
A control that runs an action when clicked is a: (a) label (b) command button (c) text box (d) check box
Correct Answer: (b) command button.
The object designed for printing is the: (a) form (b) report (c) query (d) table
Correct Answer: (b) report.
The report section printed once per record is the: (a) report header (b) detail (c) page footer (d) report footer
Correct Answer: (b) detail.
Column headings in a report go in the: (a) detail (b) page header (c) report footer (d) form
Correct Answer: (b) page header.
Printing students grouped by class is called: (a) sorting (b) grouping (c) filtering (d) indexing
Correct Answer: (b) grouping.
A grand total is placed in the: (a) page header (b) report footer (c) detail (d) form header
Correct Answer: (b) report footer.
Quick Revision Summary
- Form = easy screen to enter/view/edit data (one record at a time); made by Form Wizard or Design View.
- Controls: label, text box, combo/list box, check box, command button.
- Report = formatted output for printing (read-only); made by Report Wizard or Design View.
- Report sections: report header, page header, detail (per record), page footer, report footer.
- Grouping puts related records together; sorting orders them.
- Totals: SUM/AVERAGE/COUNT in group footer (subtotal) or report footer (grand total). Notes by freebooks.pk.
Exam Tips
- State the purpose of a form vs a report.
- Give the two ways to create a form/report.
- List the common controls and their jobs.
- Name the report sections in order.
- Explain grouping and sorting.
- Show where subtotals and grand totals go.