
Data consists of raw facts collected about things around us that we can process to generate useful information, taking many forms such as numbers, words, measurements, observations, images, and sounds. This chapter explores the two broad categories of data — qualitative (further split into nominal and ordinal) and quantitative (further split into discrete and continuous) — along with methods for organizing, collecting, storing, and visualizing data effectively.
The chapter also covers data pre-processing and analysis techniques (including statistical measures like mean, median, mode, range, variance, and standard deviation), collaborative tools and cloud storage, and closes with an introduction to data science, the data science workflow, Big Data and its 'Three Vs' (Volume, Velocity, Variety), practical applications across industries, and future trends in digital data management.
Learning Objectives
- Identify and differentiate between qualitative and quantitative data, including their sub-types
- Organize data effectively using tables, charts, and graphs
- Understand various data collection methods, including surveys, questionnaires, interviews, and observations
- Describe data storage techniques: spreadsheets, databases, data warehouses, and NoSQL
- Apply data visualization techniques to communicate information clearly
- Understand data pre-processing, including data validation, cleaning, and key statistical measures
- Understand the role of cloud storage and collaborative tools in data management
- Explain the fundamentals of data science, Big Data, and its real-world applications
Key Concepts
9.1 Data and Data Types
Data consists of raw facts collected about things around us that we can process to generate useful information — it can take many forms, including numbers, words, measurements, observations, images, and sounds, originating from sources like weather stations, sales records, surveys, websites, and social media. Understanding data is essential for comprehending situations, making informed decisions, solving problems, and driving innovation.
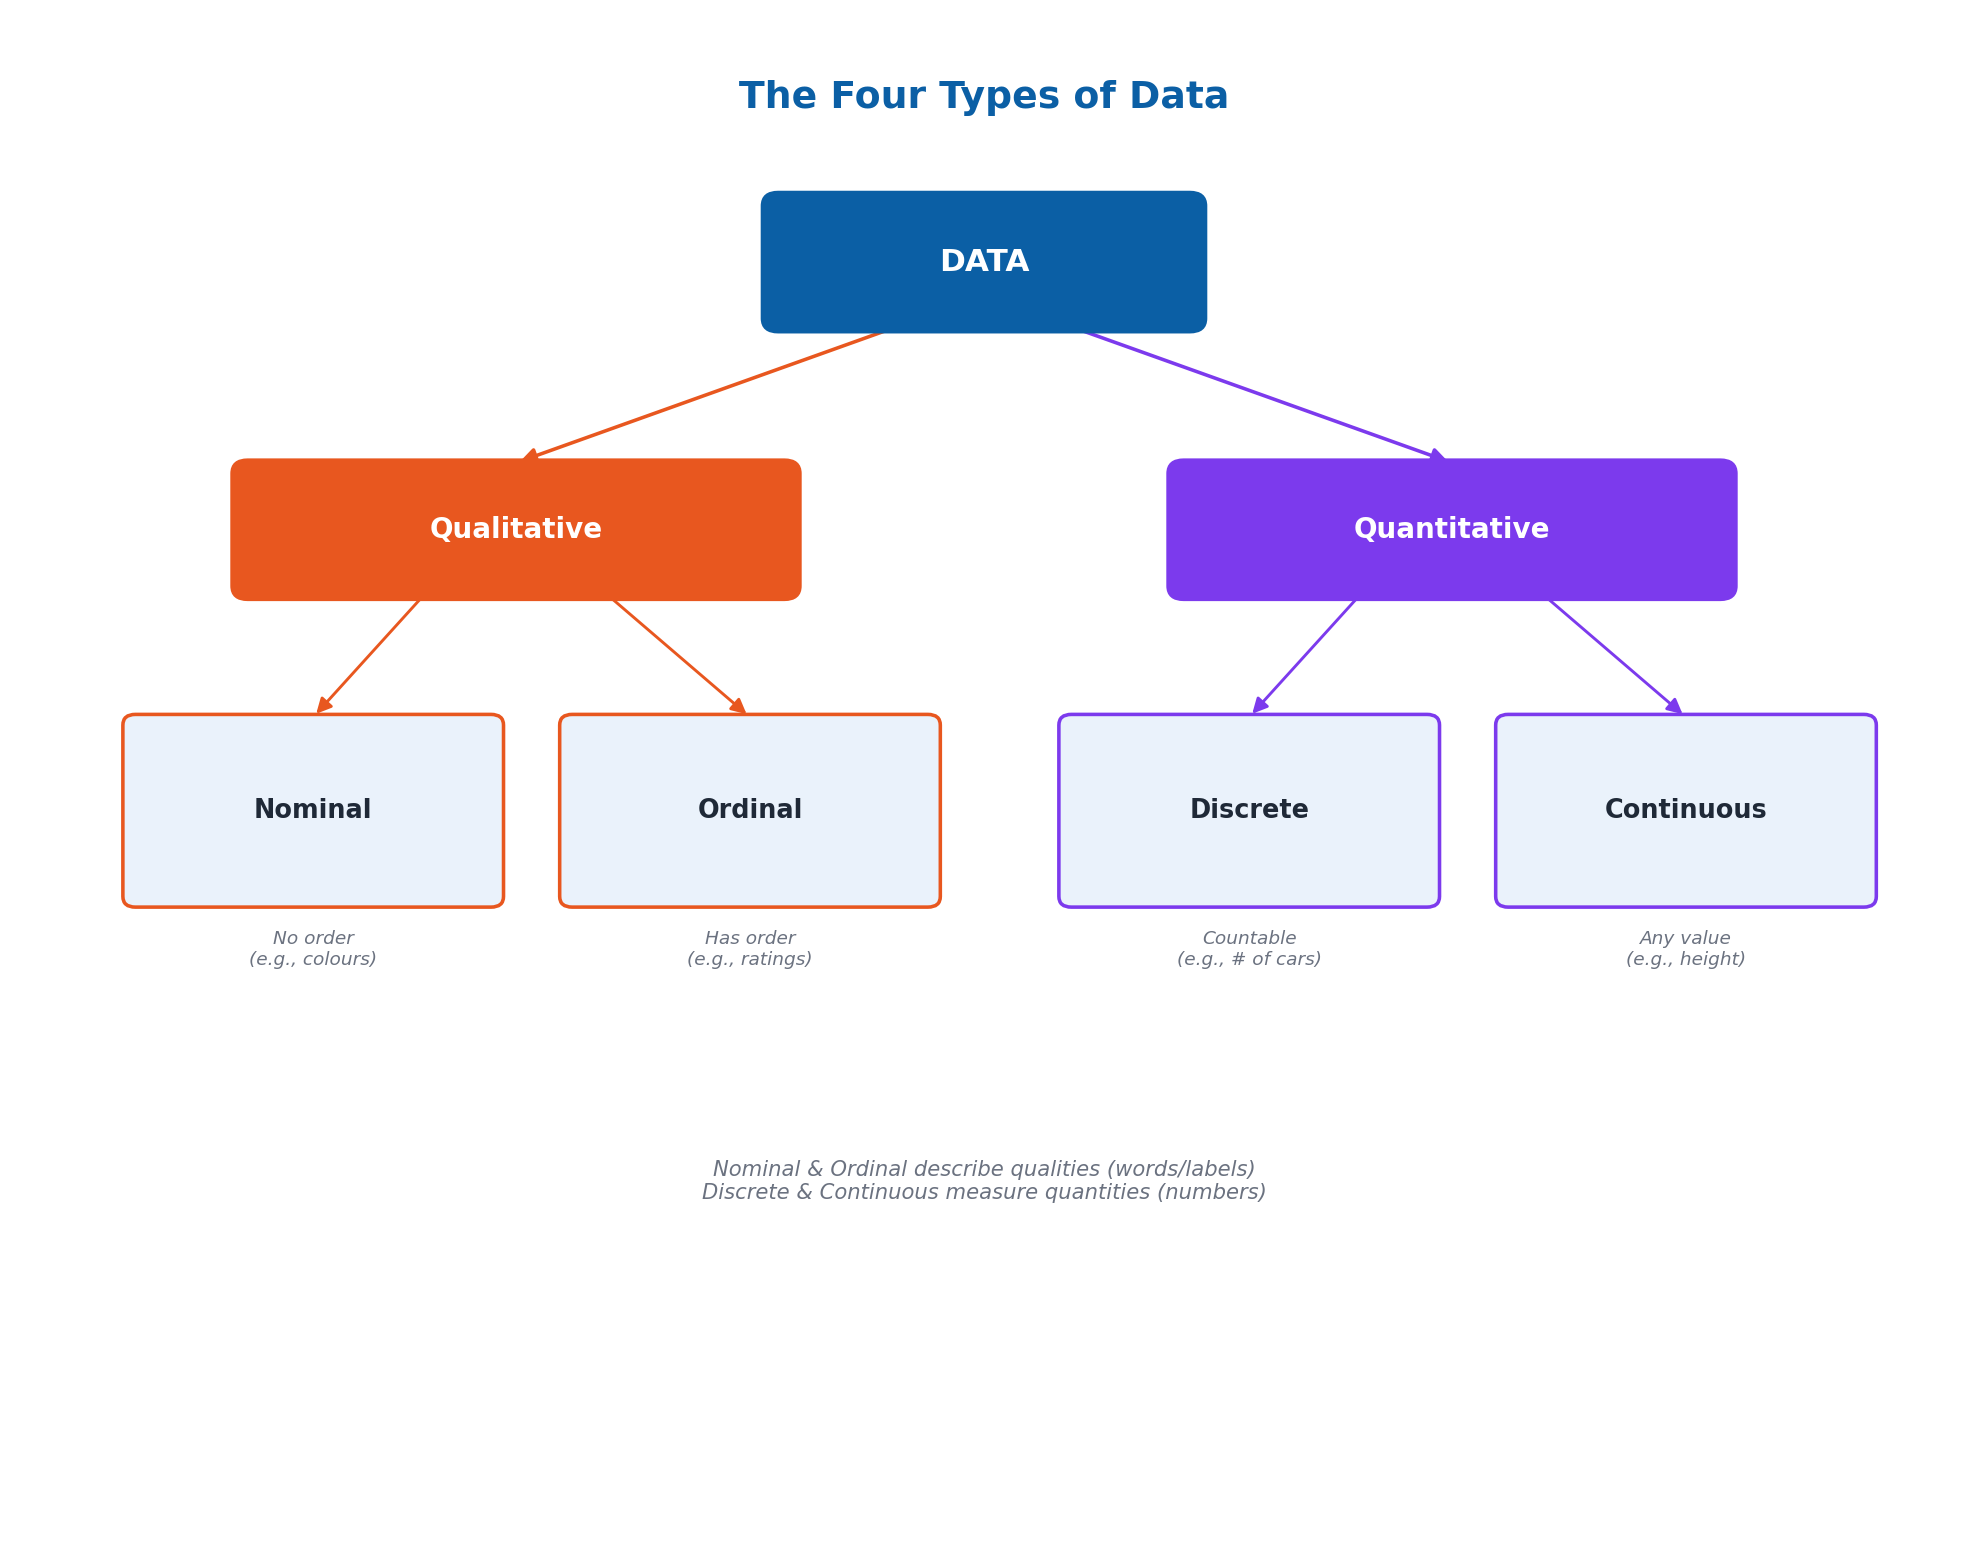
Data can be divided into two broad categories. Qualitative data refers to categories or labels that describe qualities or characteristics rather than quantities — it is non-numeric and categorical (e.g., student names, car colors, fruit types). Quantitative data consists of numbers used to measure the quantity or amount of something, answering questions like 'How much?' or 'How long?' — it is numerical, measurable, countable, and can be used in arithmetic operations.
9.2 Nominal, Ordinal, Discrete, and Continuous Data
Qualitative data is further classified into two types. Nominal Data is used to label or categorize items without implying any order (e.g., gender, types of fruit, colors) — it allows checking equality, grouping into categories, counting items, and finding the mode (most frequent category). Ordinal Data represents categories with a meaningful order, though the differences between categories are not uniform (e.g., satisfaction ratings, education levels, shirt sizes) — in addition to nominal operations, it allows comparisons, ranking, finding the median, and analyzing frequency distribution.
Quantitative data is further classified into two types. Discrete Data consists of distinct, separate, countable values, often whole numbers, answering questions like 'How many?' or 'How often?' (e.g., number of students in a class) — it supports arithmetic operations like addition and subtraction, and statistical operations like average and range. Continuous Data consists of values that can take any number within a given range, including fractions or decimals (e.g., student heights, fruit weights, temperatures) — in addition to discrete data operations, it also supports division (e.g., dividing 2.5 kg of meat among ten people, yielding 0.25 kg each).
9.3 Organizing and Collecting Data
Organizing data systematically is important for clear analysis and reduces errors — well-organized data (in tables, charts, and graphs) saves time, improves clarity, and makes it easier to draw conclusions. Data Tables present information in rows and columns for easy comparison. Charts (bar charts, line charts, pie charts) are visual representations that help identify patterns, trends, and outliers. Graphs (line graphs, bar graphs, scatter plots, histograms) show relationships between data points.
Data collection is the process of gathering information to answer questions, make decisions, or understand something better. Key methods include: Surveys (collecting information by asking questions, on paper, phone, or online, e.g., via Google Forms); Questionnaires (written forms with a set of questions); Interviews (one-on-one conversations for detailed information); Observations (watching and noting behavior in a situation); and Online Data Sources (websites, databases, and digital tools). Good survey design should be clear, specific, short, use multiple-choice/rating scales, ensure anonymity, and be tested before distribution.
9.4 Structured vs. Unstructured Data and Storage Techniques
With respect to storage and processing, data has two types. Structured Data is organized and formatted to be easily searchable and analyzable, such as data in spreadsheets and traditional databases with rows (records) and columns (attributes). Unstructured Data is more free-form and doesn't fit into a specific format, such as text from emails, social media posts, videos, and images — it is harder to organize but can be very valuable.
Four important data storage technologies exist. Spreadsheets (e.g., Excel, Google Sheets) organize data in rows and columns for simpler tasks like budgeting. Databases are like digital filing cabinets storing structured data in tables, used in banking and school records. Data Warehouses are specialized databases for storing and analyzing large amounts of data from various sources to support business decisions (e.g., Amazon Redshift, Google BigQuery). NoSQL ('Not Only SQL') databases flexibly store unstructured data using documents, key-value pairs, or graphs rather than tables (e.g., MongoDB, Cassandra), often used in big data and real-time applications.
9.5 Data Visualization
Data visualization is the process of turning numbers and information into pictures, making it easier to see patterns, trends, and relationships, and enabling quicker, better decisions. Popular visualization tools include Microsoft Excel, Google Sheets, Tableau (for detailed interactive visualizations), and Microsoft Power BI (for a wide variety of charts, graphs, and maps).
Different data types call for different visualization techniques: Nominal Data is best shown with bar charts or pie charts; Ordinal Data with bar charts or stacked bar charts; Discrete Data with histograms or dot plots; and Continuous Data with line graphs, scatter plots, or box plots. The human brain processes visuals roughly 60,000 times faster than text, which is why charts and graphs make complex information easier to understand quickly.
9.6 Data Pre-Processing and Analysis
Data pre-processing is the first and most important step in working with data, involving cleaning and organizing it before analysis — similar to washing and chopping ingredients before cooking. It involves evaluating data quality (checking for missing, incorrect, or inconsistent entries) and identifying errors (mistakes, like a score of 105 out of 100), outliers (unusual extreme values), and biases (distortions from an unrepresentative sample). Data Validation checks completeness and accuracy, while Data Cleaning removes errors, handles missing data (e.g., filling gaps with a class average), and addresses outliers.
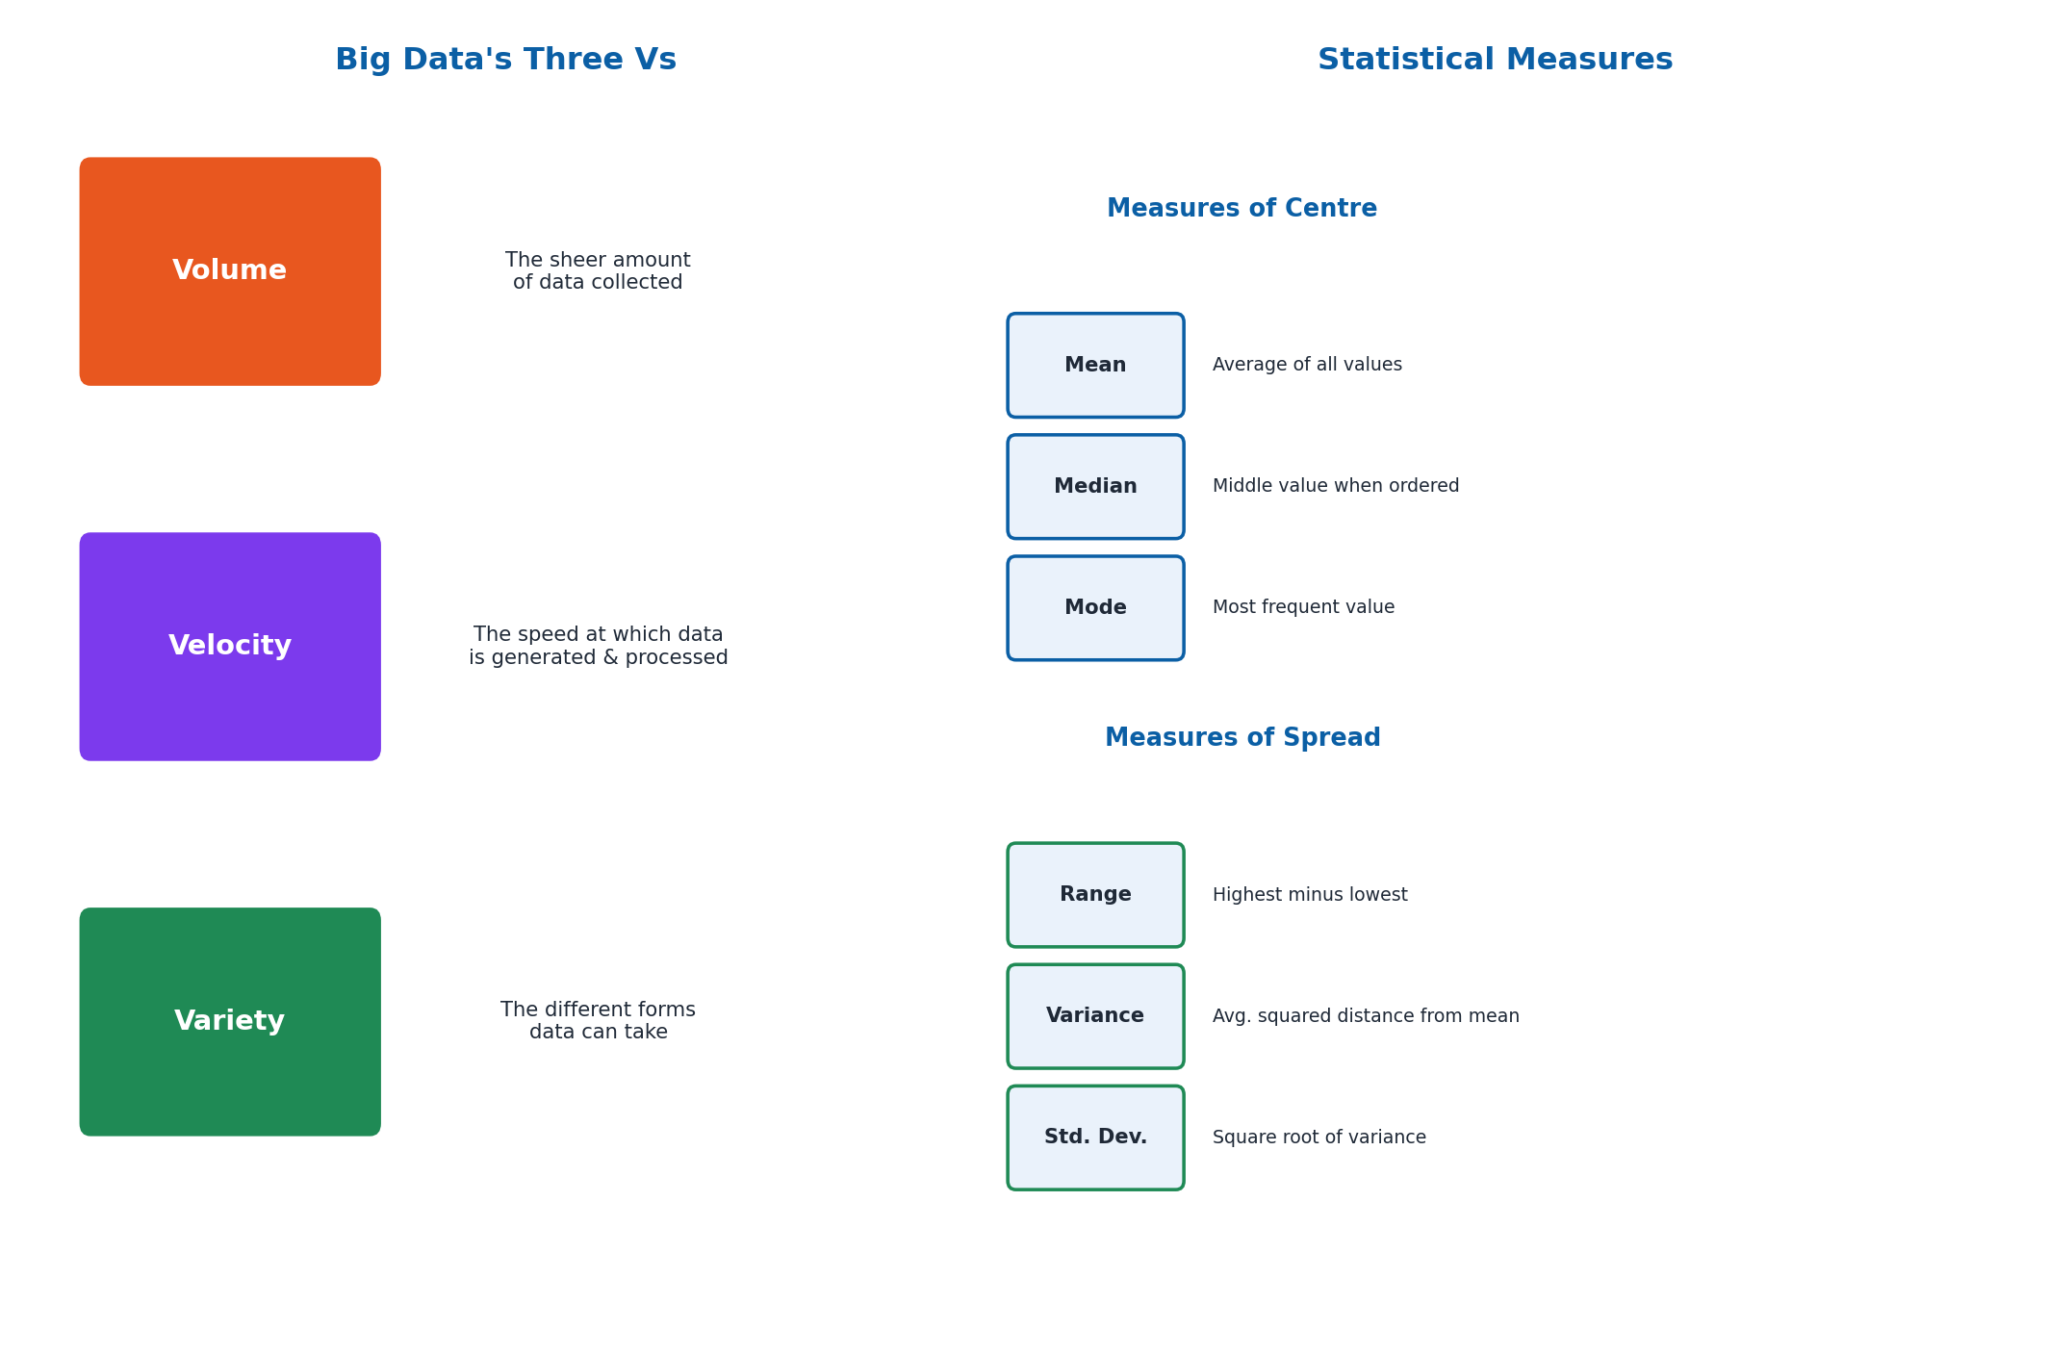
Data analysis has two main types. Quantitative Analysis uses statistics: Measures of Centre include the Mean (sum of values divided by count), Median (the middle value when ordered), and Mode (the most frequent value); Measures of Spread include the Range (highest minus lowest value), Variance (S² = Σ(xᵢ-x̄)²/(n-1), how spread out values are from the mean), and Standard Deviation (S = √Variance, the average distance of data points from the mean). Qualitative Analysis deals with non-numeric data like text, using methods such as Content Analysis (counting how often specific words/themes appear) and Thematic Analysis (identifying and interpreting broader themes and patterns).
9.7 Collaborative Tools and Cloud Storage
Cloud storage has become essential for how we store, access, and share information — saving files on the internet for access from any device, creating backups, and enabling real-time collaboration. Remote Access is the ability to connect to and use a computer or network from a distant location (e.g., editing a Google Drive file from home and later from school). Data Backups are copies of important data stored separately from the original to protect against loss from accidental deletion, hardware failure, or viruses.
Collaborative Authoring is the process of multiple people working together to create, edit, and improve a document or project in real-time using online tools (e.g., a group working together on Google Slides). Key benefits of collaborative tools include Enhanced Productivity (multiple people working on different sections simultaneously) and Version Control (automatically saving every change, so previous versions can be recovered and each person's edits are tracked).
9.8 Introduction to Data Science and Big Data
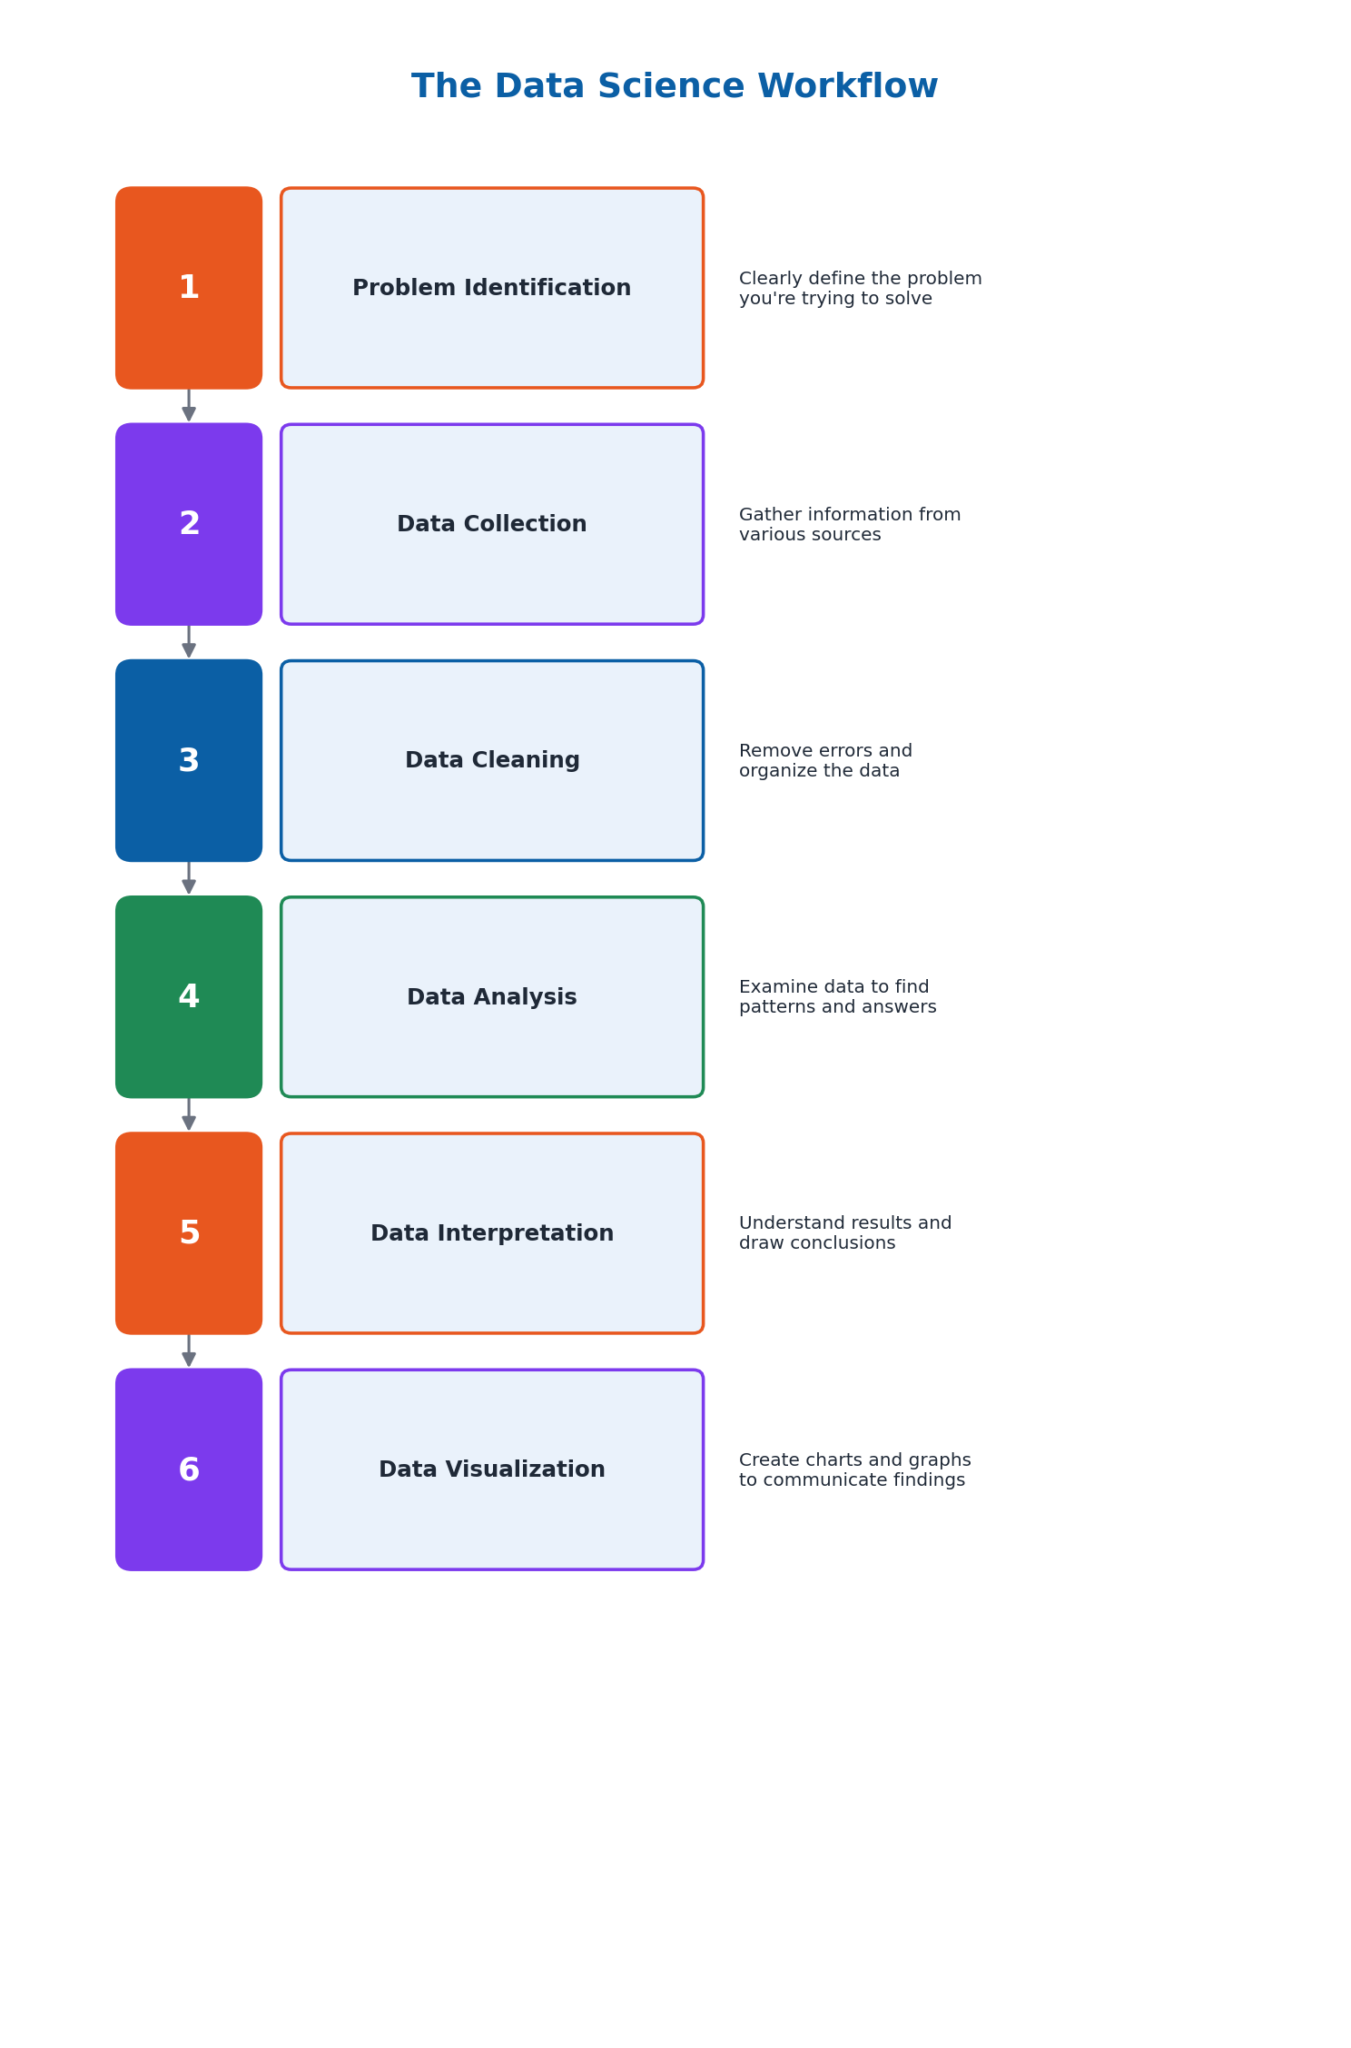
Data science is like being a detective, but instead of solving crimes, you solve problems using data — combining computer science (for handling and organizing data), mathematics and statistics (for analyzing data and finding patterns), and business knowledge (for applying insights to real-life decisions). The Data Science Workflow follows six steps: Problem Identification, Data Collection, Data Cleaning, Data Analysis, Data Interpretation, and Data Visualization.
Big Data refers to extremely large and complex data sets that are difficult to process using traditional methods, characterized by the 'Three Vs': Volume (the sheer amount of data collected), Velocity (the speed at which data is generated and processed), and Variety (the different forms data can take — text, images, videos, numbers). Big Data has practical applications in retail (product recommendations), healthcare (predicting disease outbreaks), finance (fraud detection), and transportation (route optimization). Key data science tools include Excel, Python (with Pandas and Matplotlib), R, and SQL, while important techniques include Predictive Modelling (forecasting future events from historical data) and Graph Analytics (analyzing relationships between data points, e.g., social networks).
Important Definitions
What is data?
Raw facts collected about things around us that can be processed to generate useful information, taking forms such as numbers, words, measurements, images, or sounds.
What is qualitative data?
Data that refers to categories or labels describing qualities or characteristics rather than quantities, represented by words, labels, or symbols instead of numbers.
What is quantitative data?
Numerical data used to measure the quantity or amount of something, which is measurable, countable, and can be used in arithmetic operations.
What is structured data?
Data that is organized and formatted to be easily searchable and analyzable, such as data stored in spreadsheets and traditional databases with rows and columns.
What is data visualization?
The process of turning numbers and information into pictures, such as charts and graphs, to make patterns, trends, and relationships easier to understand.
What is data science?
An interdisciplinary field that combines computer science, mathematics/statistics, and business knowledge to gather, analyze, and interpret data to solve problems and find useful insights.
What is Big Data?
Extremely large and complex data sets that are difficult to process using traditional methods, characterized by the Three Vs: Volume, Velocity, and Variety.
What is an outlier?
An unusual or extreme value in a dataset that doesn't fit the general pattern of the rest of the data.
Key Facts and Relations
| Topic | Key Fact / Relation |
|---|---|
| 2 broad data categories | Qualitative Data and Quantitative Data |
| 4 data sub-types | Nominal, Ordinal (qualitative); Discrete, Continuous (quantitative) |
| 4 data storage technologies | Spreadsheets, Databases, Data Warehouses, NoSQL |
| 3 Vs of Big Data | Volume (amount), Velocity (speed), Variety (different forms) |
| 3 measures of centre | Mean (average), Median (middle value), Mode (most frequent value) |
| Variance formula | S² = Σ(xᵢ – x̄)² / (n – 1) |
| Standard deviation formula | S = √Variance = √[Σ(xᵢ – x̄)² / (n – 1)] |
| 6-step Data Science Workflow | Problem Identification → Data Collection → Data Cleaning → Data Analysis → Data Interpretation → Data Visualization |
Diagrams
The Four Types of Data: A hierarchy diagram showing how Data splits into Qualitative (Nominal, Ordinal) and Quantitative (Discrete, Continuous) types, with examples
The Data Science Workflow: A six-step flow diagram showing the data science process: Problem Identification, Data Collection, Data Cleaning, Data Analysis, Data Interpretation, and Data Visualization
Big Data's Three Vs and Statistical Measures: A diagram showing Big Data's Volume, Velocity, and Variety, alongside the key statistical measures of centre and spread used in quantitative analysis
Short Questions & Answers
What is the difference between qualitative and quantitative data?
Qualitative data describes qualities or characteristics using categories or labels (non-numeric), while quantitative data consists of numbers that measure the quantity or amount of something and can be used in arithmetic operations.
Give an example of continuous data and explain why it is considered continuous.
Student height (e.g., 150.5 cm) is continuous data because it can take any value within a range, including fractions or decimals, rather than being limited to distinct, separate whole numbers.
Which method would you use to collect opinions from a large group of people about a new school policy?
A survey (potentially distributed online using a tool like Google Forms) would be an efficient method, as it allows many people to answer a standard set of questions quickly and the responses can be easily compiled and analyzed.
What type of data is the number of students in your class?
It is discrete quantitative data, since it consists of distinct, countable whole-number values (you cannot have a fractional number of students).
Why is it important to organize data into tables or charts before analyzing it?
Organizing data reduces errors, saves time when searching for information, and improves clarity, making it much easier to identify patterns, draw conclusions, and make decisions than working with a messy or unorganized list.
What is one advantage of using online tools like Google Forms for collecting survey data?
Online tools like Google Forms make it easy to distribute surveys widely, automatically compile responses, and quickly organize the collected data for analysis, saving significant time compared to paper-based surveys.
Explain why data visualization is important.
Data visualization turns complex numbers and information into pictures like charts and graphs, making it much easier and faster to see patterns, trends, and relationships, and supporting quicker, better-informed decisions.
What does the 'Variety' characteristic of Big Data refer to?
Variety refers to the different forms data can take, such as numbers, text, images, and videos — Big Data includes this wide range of data types and formats, not just numeric data.
Long Questions & Answers
Explain the differences between qualitative and quantitative data, and further differentiate between their respective sub-types, providing examples of each.
What is the fundamental difference between qualitative and quantitative data?
Data can broadly be divided into two categories: qualitative data and quantitative data. Qualitative data refers to categories or descriptive labels used to describe the qualities or characteristics of something, rather than a specific measurable quantity, and is generally represented using words, labels, or symbols rather than numbers. Quantitative data, by contrast, consists of actual numbers used to measure the specific quantity or amount of something. Qualitative data is further sub-divided into nominal and ordinal data, while quantitative data is further sub-divided into discrete and continuous data.
What is nominal data, and what operations can be performed on it?
Nominal data is used to label or categorize different items without implying any meaningful order between the categories, such as categorizing people according to gender, or fruit according to type (apple, banana, orange). Operations that can meaningfully be performed on nominal data include checking for equality, grouping items into categories, counting the number of items within each category, and identifying the single most frequently occurring category, known as the mode.
What is ordinal data, and how does it differ from nominal data?
Ordinal data represents categories that do have a meaningful underlying order between them, even though the actual differences between successive categories may not be perfectly uniform, such as customer satisfaction ratings (satisfied, neutral, unsatisfied) or shirt sizes (small, medium, large). In addition to all the operations available for nominal data, ordinal data also allows for meaningful comparisons and rankings between categories, along with the calculation of a median value.
What is discrete data, and what operations can be performed on it?
Discrete data consists of distinct, individually separate values that are properly countable, generally expressed as whole numbers, such as the total number of students present in a class. In addition to the operations already available for nominal and ordinal data, discrete data also allows for arithmetic operations (such as addition and subtraction) and statistical operations (such as calculating an average or a range) to be performed on it.
What is continuous data, and how does it differ from discrete data?
Continuous data consists of values that can take on any number at all within a given specified range, including fractional or decimal values, such as a student's height measured as 150.5 centimetres. In addition to all the operations available for discrete data, continuous data also allows for division to meaningfully be performed on it — for example, dividing 2.5 kilograms of meat among ten people — in a way that would clearly not be possible with a genuinely discrete quantity such as three indivisible cars.
Describe the complete Data Science Workflow, using a worked example to illustrate each of its six individual steps.
What happens in the Problem Identification and Data Collection steps of the Data Science Workflow?
Problem Identification involves properly understanding and clearly defining the precise underlying problem one is attempting to solve — for example, a school wanting to understand why a certain number of its students have been consistently arriving late to class. Data Collection then involves gathering the relevant necessary information from various appropriate sources — continuing the example, the school would begin by collecting detailed data regarding the actual arrival times of its students.
What happens in the Data Cleaning step of the Data Science Workflow?
Data Cleaning involves removing errors from the collected data and then organizing it appropriately, in much the same way one might tidy up a messy room by putting every item back into its own correct designated place. In the school example, this would involve identifying and then properly fixing any obvious inconsistencies or errors that might exist within the originally collected arrival-time data.
What happens in the Data Analysis step of the Data Science Workflow?
Data Analysis involves closely and carefully examining the now properly cleaned data in order to identify any meaningful underlying patterns. In the school example, this would involve analysing the data to determine whether specific likely factors, such as adverse weather conditions or heavy traffic congestion, might actually be the underlying primary cause of these particular late arrivals. This step is where cleaned data actually starts to reveal something useful about the original problem being investigated.
What happens in the Data Interpretation step of the Data Science Workflow?
Data Interpretation involves properly understanding what the various analysed patterns actually mean in a genuinely meaningful practical sense, and then drawing appropriate conclusions from them. In the school example, this would involve the school properly concluding that heavy traffic congestion during a certain particular time of day does indeed appear to be the primary underlying cause of a majority of these late arrivals.
What happens in the Data Visualization step of the Data Science Workflow?
Data Visualization involves creating clear, easily understandable charts or graphs in order to properly communicate the findings from the earlier steps to other people. In the school example, this would involve creating a simple, clear chart that visually displays the various most common specific reasons for the late arrivals, making the school's overall findings considerably easier for teachers, parents, and school administrators alike to properly and quickly understand at a single glance.
Explain the concept of Big Data, its defining characteristics (the Three Vs), and discuss its practical applications across at least three different industries.
What is Big Data, and what does Volume refer to?
Big Data refers to extremely large and highly complex sets of data that have become too difficult to properly process using more traditional, older data-processing methods and tools, largely because of both the sheer scale and inherent complexity of this kind of data. Data scientists generally characterize Big Data using three defining characteristics, the 'Three Vs.' The first, Volume, refers to the sheer total amount of data being collected at any given time — for example, the enormous number of posts, likes, and comments shared across social media platforms on a single day.
What does Velocity refer to in the context of Big Data?
Velocity refers to the actual speed at which new data is being both generated and subsequently processed. A concrete example of this is the way new social media posts are continuously and rapidly sent out and received essentially in real time, in a way that has often been usefully compared to the fast, continuous flow of traffic along an extremely busy highway.
What does Variety refer to in the context of Big Data?
Variety refers to the many different forms that a given set of data can actually take, since Big Data is very often not limited to simple numeric values alone, but can also include various forms of text, images, and video content. A concrete example is a company that separately collects customer reviews as raw text, product photographs as images, and its own sales figures as numeric values.
How is Big Data applied in the retail and healthcare industries?
Within the retail industry, individual stores analyse large amounts of collected customer data to correctly determine which particular products tend to be most popular at different times of year, helping those stores stock the correct items and improve their overall sales performance. Within the healthcare industry, hospitals and doctors similarly analyse large amounts of collected patient data to help anticipate seasonal disease outbreaks, such as an annual flu outbreak, well enough in advance to properly prepare adequate vaccine supplies ahead of time.
How is Big Data applied in the finance industry?
Within the finance industry, banks analyse large amounts of collected customer transaction data to help correctly detect unusual or suspicious spending patterns that might potentially indicate an occurrence of fraud, helping those banks act quickly enough to properly protect their customers' money from being stolen. Together, these real-world examples illustrate how Big Data, combined with modern analytical techniques, helps many kinds of organizations make considerably better, more well-informed decisions across many different fields and industries.
Multiple Choice Questions (MCQs)
What is data? (A) Processed information (B) Raw facts gathered about things (C) A collection of numbers only (D) A list of observed events
Correct answer: (B) Raw facts gathered about things. Data refers to raw facts gathered about things around us, which can then be processed to generate useful information.
Which of the following is an example of qualitative data? (A) Temperature readings in degrees Celsius (B) Number of students in a class (C) Favourite ice cream flavours (D) Test scores out of 100
Correct answer: (C) Favourite ice cream flavours. Favourite ice cream flavours are qualitative (nominal) data, since they are categories/labels rather than numeric measurements.
What type of data involves distinct, separate values that are countable? (A) Nominal Data (B) Ordinal Data (C) Discrete Data (D) Continuous Data
Correct answer: (C) Discrete Data. Discrete data consists of distinct, separate, countable values, often expressed as whole numbers.
What is an example of continuous data? (A) Number of cars in a parking lot (B) Height of students in centimetres (C) Types of fruits (D) Shirt sizes (small, medium, large)
Correct answer: (B) Height of students in centimetres. Height in centimetres is continuous data because it can take any value within a range, including decimals.
What type of data is used to categorize items without implying any order? (A) Ordinal Data (B) Discrete Data (C) Nominal Data (D) Continuous Data
Correct answer: (C) Nominal Data. Nominal data is used to label or categorize items without implying any specific order between the categories.
How can you organise data to make it easier to analyse? (A) By writing it in long paragraphs (B) By creating tables, charts, and graphs (C) By storing it in random files (D) By keeping it in a messy notebook
Correct answer: (B) By creating tables, charts, and graphs. Organizing data into tables, charts, and graphs makes it much easier to compare, interpret, and analyze.
Which tool can be used to create surveys online? (A) Microsoft Word (B) Google Forms (C) Excel Spreadsheets (D) Adobe Photoshop
Correct answer: (B) Google Forms. Google Forms is a free online tool specifically designed for creating surveys and collecting responses.
What is the primary purpose of data visualization? (A) To generate random numbers (B) To convert text into data (C) To make data easier to understand by turning it into pictures (D) To hide complex data
Correct answer: (C) To make data easier to understand by turning it into pictures. Data visualization turns numbers and information into pictures (charts, graphs) to make patterns and trends easier to understand.
What is the first step in the data science process? (A) Data Cleaning (B) Data Analysis (C) Data Collection (D) Understanding the problem
Correct answer: (D) Understanding the problem. Problem Identification (understanding and clearly defining the problem) is the first step in the Data Science Workflow.
What does the 'Volume' characteristic of Big Data refer to? (A) The speed at which data is generated (B) The different forms data can take (C) The sheer amount of data being collected (D) The way data is processed
Correct answer: (C) The sheer amount of data being collected. Volume refers to the sheer amount of data being collected, one of the Three Vs (Volume, Velocity, Variety) that define Big Data.
Quick Revision Summary
- 2 broad data categories: Qualitative (non-numeric) and Quantitative (numeric)
- 4 sub-types: Nominal, Ordinal (qualitative); Discrete, Continuous (quantitative)
- 4 storage technologies: Spreadsheets, Databases, Data Warehouses, NoSQL
- Visualization by type: Nominal→bar/pie; Ordinal→bar/stacked bar; Discrete→histogram/dot plot; Continuous→line/scatter/box plot
- Measures of centre: Mean, Median, Mode; Measures of spread: Range, Variance, Standard Deviation
- Data pre-processing: evaluate quality → identify errors/outliers/bias → validate → clean
- Data Science Workflow: Problem ID → Collection → Cleaning → Analysis → Interpretation → Visualization
- Big Data's 3 Vs: Volume (amount), Velocity (speed), Variety (different forms)
Exam Tips
- Remember: Qualitative = Quality (words/labels); Quantitative = Quantity (numbers)
- Nominal has NO order; Ordinal HAS order — remember 'Ordinal = Ordered'
- Discrete = countable whole numbers (how many); Continuous = any value in a range, including decimals (how much/long)
- Mean is affected by outliers; Median is not — use median when data has extreme values
- Standard deviation is just the square root of variance — always compute variance first
- Big Data's 3 Vs: Volume, Velocity, Variety — a very common exam question