Statistics is the mathematical science of making decisions and drawing conclusions from data in situations of uncertainty. It includes designing experiments, and the collection, organization, summarization, analysis, and interpretation of numerical data. Although the word statistics was first used in the 18th century to describe the collection of data by the state, the modern subject has grown far beyond that, now including probability theory and applied mathematics, and drawing on computers to perform routine statistical analysis.
This chapter introduces the basic vocabulary and ideas that the rest of the subject builds on: population and sample, parameter and statistic, the two broad types of variables (quantitative and qualitative), and the distinction between descriptive statistics (organizing and summarizing data) and inferential statistics (drawing conclusions about a population from a sample). It also introduces the shorthand notations — sigma (sum), product, and factorial — used throughout the subject, and surveys where statistics is applied across social sciences, plant sciences, physical sciences, and medical sciences.
Learning Objectives
- Define statistics and trace briefly how its meaning has evolved since the 18th century
- Distinguish between population and sample, and between parameter and statistic
- Explain ratio, proportion, percentage, and sampling variability with examples
- Distinguish between an experiment and a sample survey
- Describe constants, order statistics, and the linear additive model (Yi = mu + epsilon)
- Use sigma, product, and factorial notation correctly
- Identify quantitative (discrete/continuous) and qualitative (categorical) variables
- Distinguish between descriptive statistics and inferential statistics
Key Concepts
1.1 What Is Statistics?
The word statistics was first used by the German scholar Gotfried Achenwall in the mid-18th century for the science of statecraft concerning the collection and use of data by the state. Through the 19th century, the word acquired a much wider meaning, covering numerical data of almost any subject along with the interpretation of that data through appropriate analysis. Since the early 1920s, the growth of the experimental sciences created a need for reliable scientific methods of analyzing the results of experiments and surveys, and the modern subject of statistics grew largely out of the practical problems faced by experimenters themselves.
Today, statistics is defined as the mathematical science of making decisions and drawing conclusions from data in situations of uncertainty. It includes designing experiments, and the collection, organization, summarization, analysis, and interpretation of numerical data. In everyday usage, the word 'statistics' often just refers to numbers or facts — such as statistics of births or road accidents — while 'a statistic' (singular) is a specific statistical term for a quantity calculated from sample values. Data is the general term for numerical facts, and datum is a single numerical fact.
1.2 Population, Sample, Parameter, and Statistic
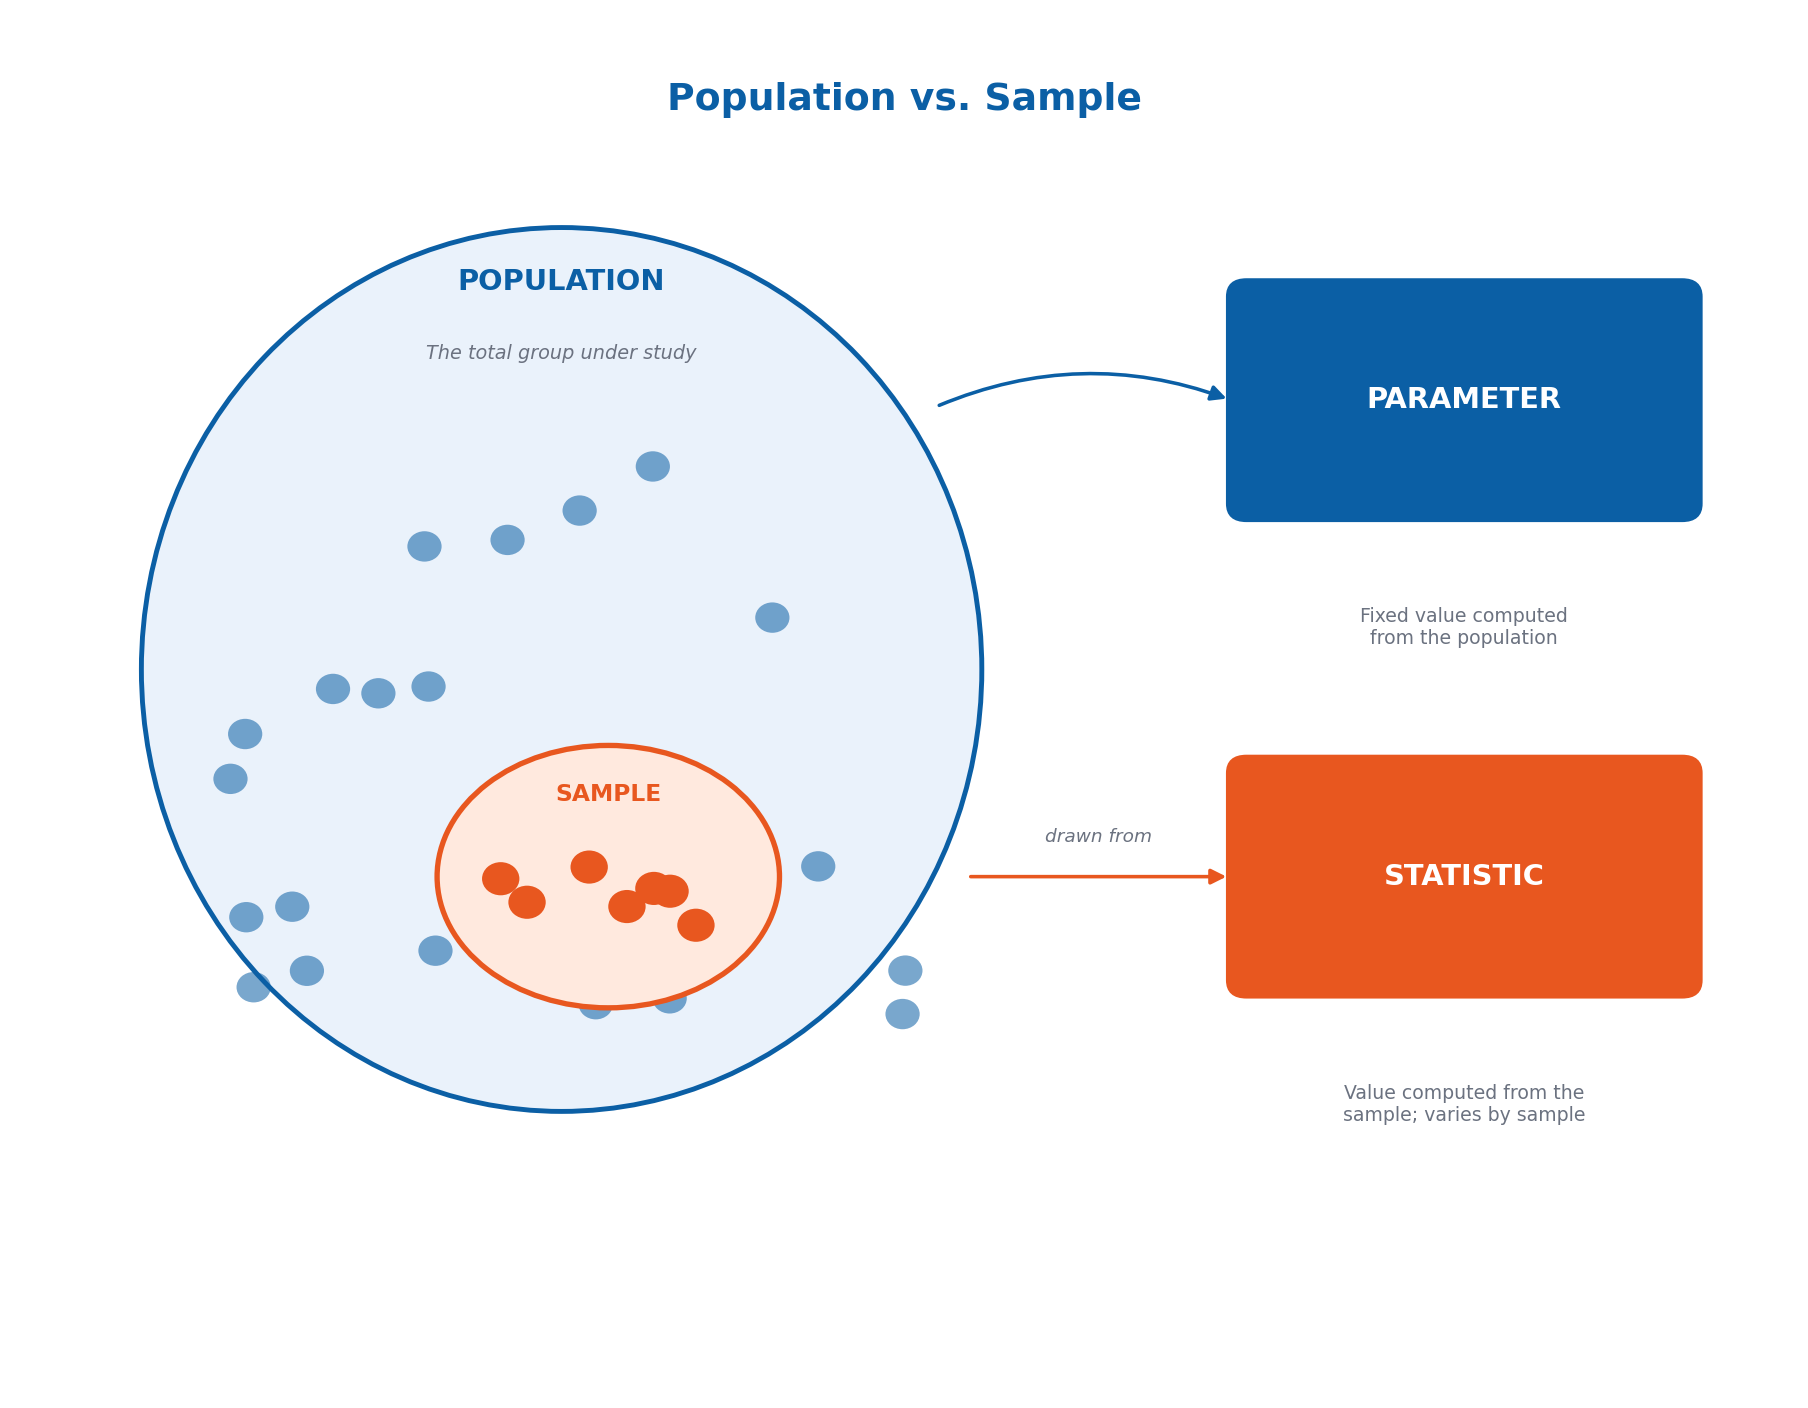
Population is the total group under discussion, or the group to which the results will be generalized. Sample is a subset of the population chosen when measurements cannot practically be made on the whole population; for a sample to give meaningful inferences about the population, it must be representative of that population.
Parameter is a quantity computed from a population when the entire population is available — parameters are fixed, constant quantities, though they are usually unknown in practice. Statistic is a quantity computed from a sample, and unlike a parameter, a statistic is variable because it changes from sample to sample. This natural variation across different possible samples from the same population is called sampling variability.
1.3 Ratio, Proportion, and Percentage
Ratio is the fraction A/B, the ratio of quantity A to quantity B. Proportion is a special ratio of a part to its total — for example, if 300 of 500 surveyed students are female, the proportion of females is 300/500. A proportion becomes a percentage when multiplied by 100; in this example, the female percentage is (300/500) x 100 = 60%, meaning 60 out of every 100.
These simple ideas — ratio, proportion, and percentage — recur constantly throughout statistics, from describing sample composition to summarizing survey results, and form the foundation for later measures like relative frequency.
1.4 Experiments and Sample Surveys
An experiment is any study in which the researcher can control the allocation of treatments to the experimental units; every unit must be capable of receiving every treatment, and an allocation mechanism decides which unit receives which treatment. A mechanism where the scientist observes a unit and then decides which treatment to apply is considered unsatisfactory, since it risks subjective bias — a scientifically acceptable mechanism instead assigns treatments according to a fixed rule.
A sample survey, by contrast, has no treatments at all: the units in the population under study are listed in a frame, and a sample of units is selected from that frame using a selection mechanism. The feature that distinguishes an experiment from a sample survey is therefore control over allocation (experiments) versus control over selection (surveys).
1.5 Constants, Order Statistics, and Models
A constant is a quantity that does not vary from individual to individual, such as pi (about 3.14159) or e (about 2.71828). The order statistic of a data set Y1, Y2, …, Yn is simply that data arranged in order of magnitude, denoted Y(1), Y(2), …, Y(n), where Y(1) is the minimum and Y(n) is the maximum. Data arranged from smallest to largest is in ascending order; from largest to smallest, it is in descending order.
A model is a mathematical statement used to study the results of an experiment or predict the behaviour of future repetitions of it, and typically involves probability distributions describing the variability we would expect across different samples. The simplest linear additive model describes an observation as a mean plus a random error: Yi = mu + epsilon_i, where mu is the population mean and epsilon_i is the random error (the chance variation in an observational process, not to be confused with a human 'mistake'). Rearranging gives epsilon_i = Yi – mu, the deviation of an observation from the mean; since random errors are assumed to average to zero, there are approximately equal numbers of positive and negative deviations.
1.6 Notations: Sigma, Product, and Factorial
Sigma (the Greek letter Sigma) is shorthand for summation: the sum of Y1 through Y5 is written as the sum, from i=1 to 5, of Yi. It tells us to add all the Yi values starting at the lower limit (i=1) and stopping at the upper limit (i=5), assuming consecutive integer values unless stated otherwise.
Product (the Greek letter Pi) is shorthand for multiplication: the product of Y1 through Yn is written as the product, from i=1 to n, of Yi, meaning Y1 x Y2 x Y3 x … x Yn. Factorial, written n!, is defined as n x (n-1) x (n-2) x … x 3 x 2 x 1 — for example, 4! = 4x3x2x1 = 24. By definition, 1! = 1 and, notably, 0! = 1 as well.
1.7 Importance of Statistics in Various Disciplines
Because data collected from any field almost always involves some variability or uncertainty, statistics has applications across virtually every field of research, helping researchers analyze, interpret, and communicate their findings. Statistics applied to economics is called econometrics, applied to biological sciences it is called biometry, and there are similarly named applications like psychometry in other fields.
In social sciences, statistics helps establish relationships between variables through hypothesis testing, with econometric models supporting economic forecasting and planning. In plant sciences, the 'Design of Experiments' technique supports efficient experimentation, such as determining optimum plot sizes for crops like wheat, cotton, and sugarcane. In physical sciences, linear and nonlinear regression models establish cause-and-effect relationships, with computers now enabling simulation alongside direct experimentation. In medical sciences, statistics supports investigating drug effectiveness and environmental effects, planning future studies, and integrating new data with existing findings.
1.8 Variables and Descriptive vs. Inferential Statistics
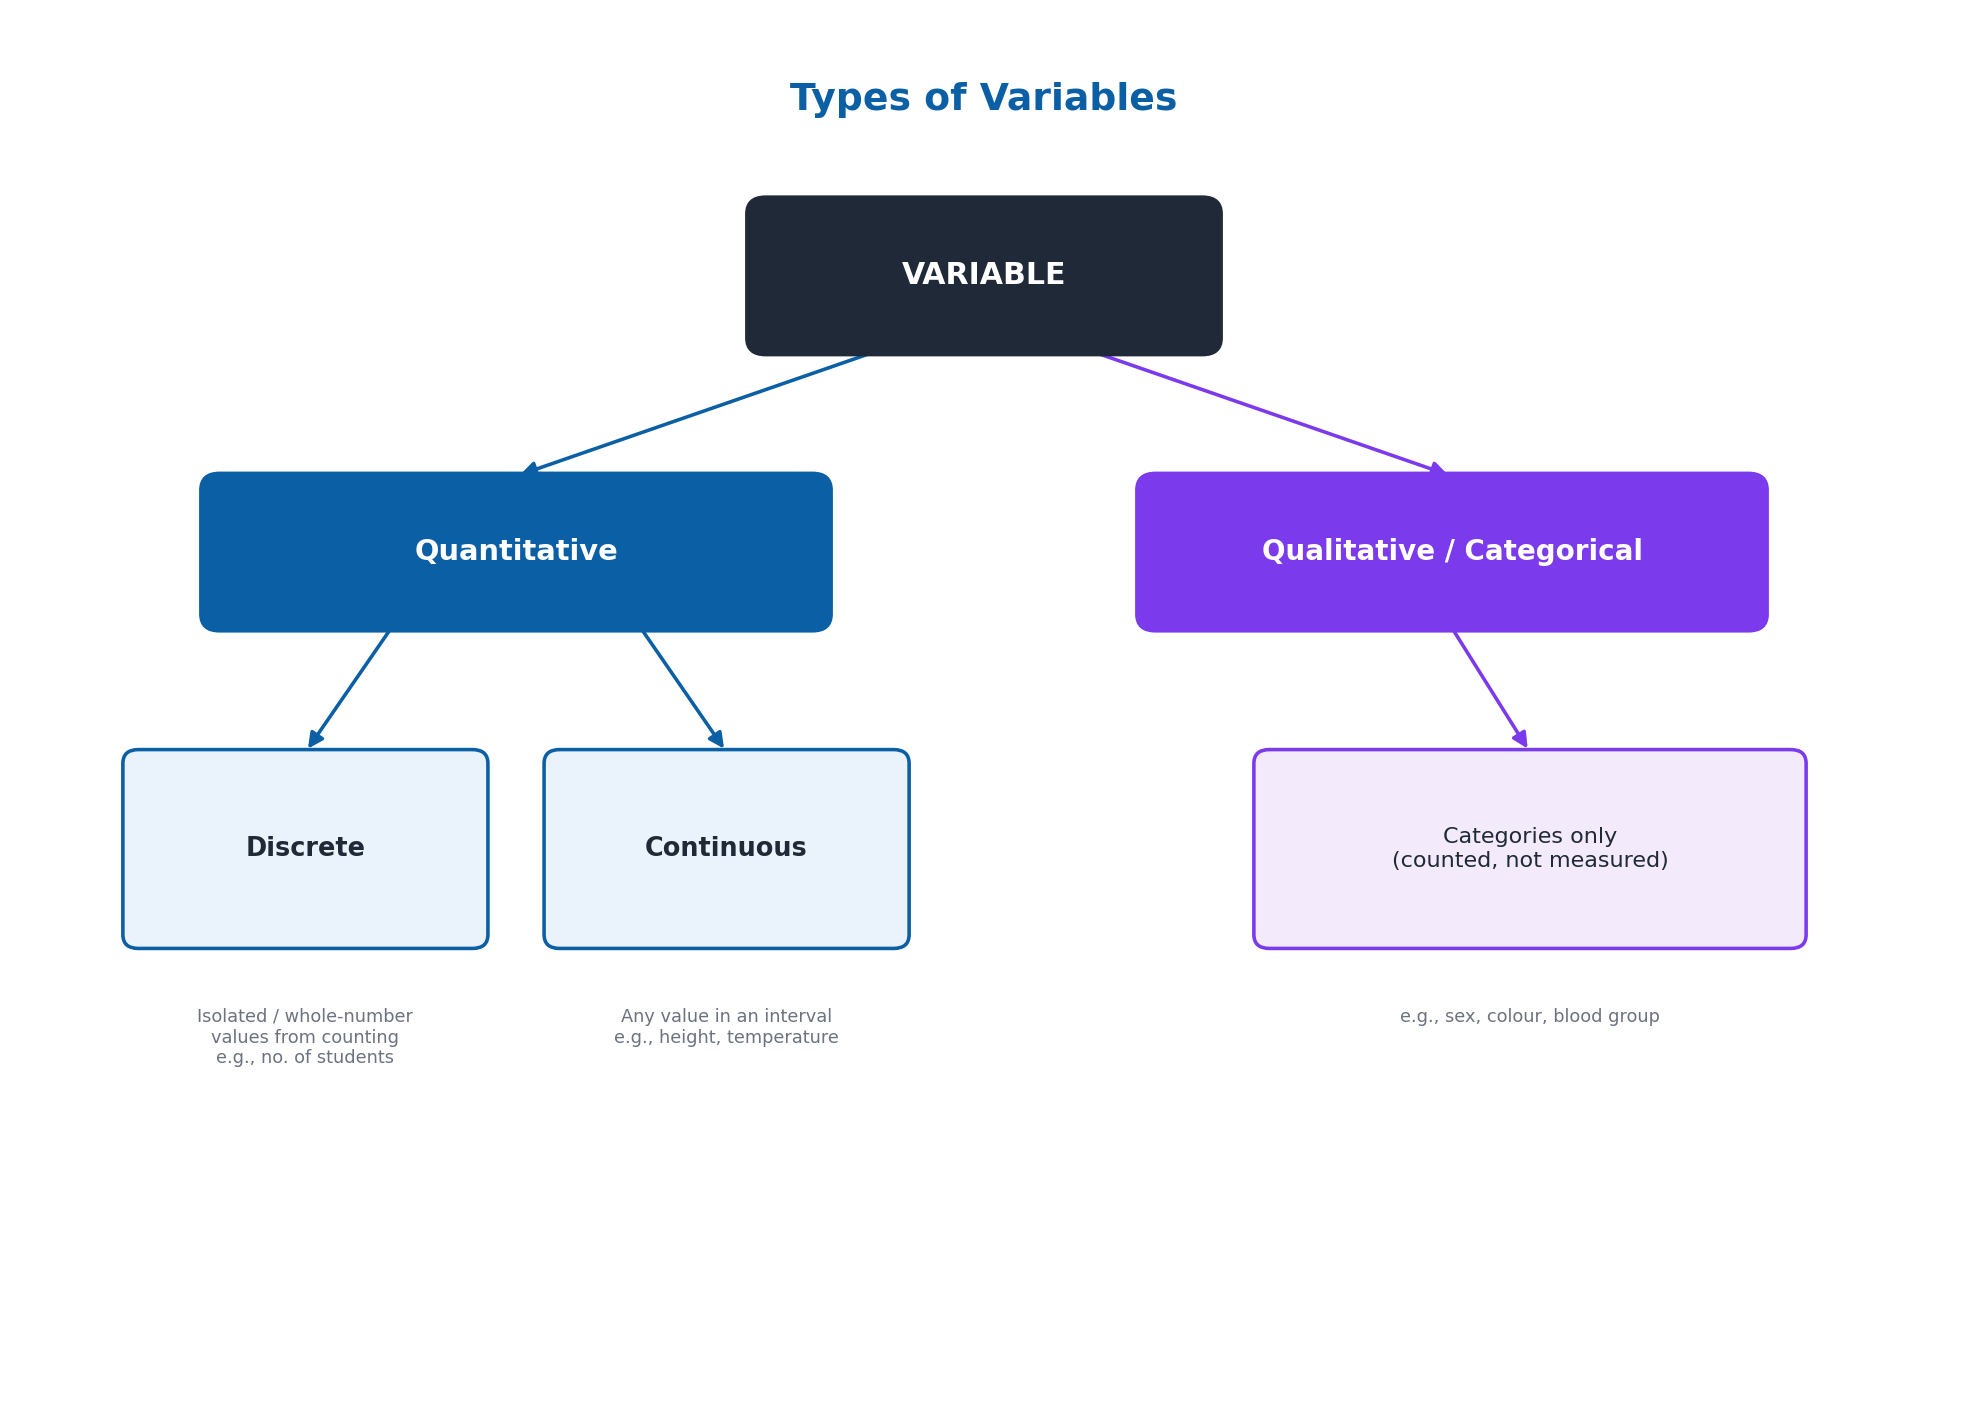
A variable is a characteristic that varies from individual to individual in a population, such as plant height or eye colour. Variables are broadly of two types. A quantitative variable is one capable of taking a numerical value, and is further split into continuous variables (which can take any value in an interval, like temperature or plant height) and discrete variables (which take only isolated values, usually positive integers arising from counting, like the number of students in a class). A qualitative or categorical variable is not capable of numerical measurement — observations are instead allocated to mutually exclusive categories, such as sex or colour, and can only be counted.
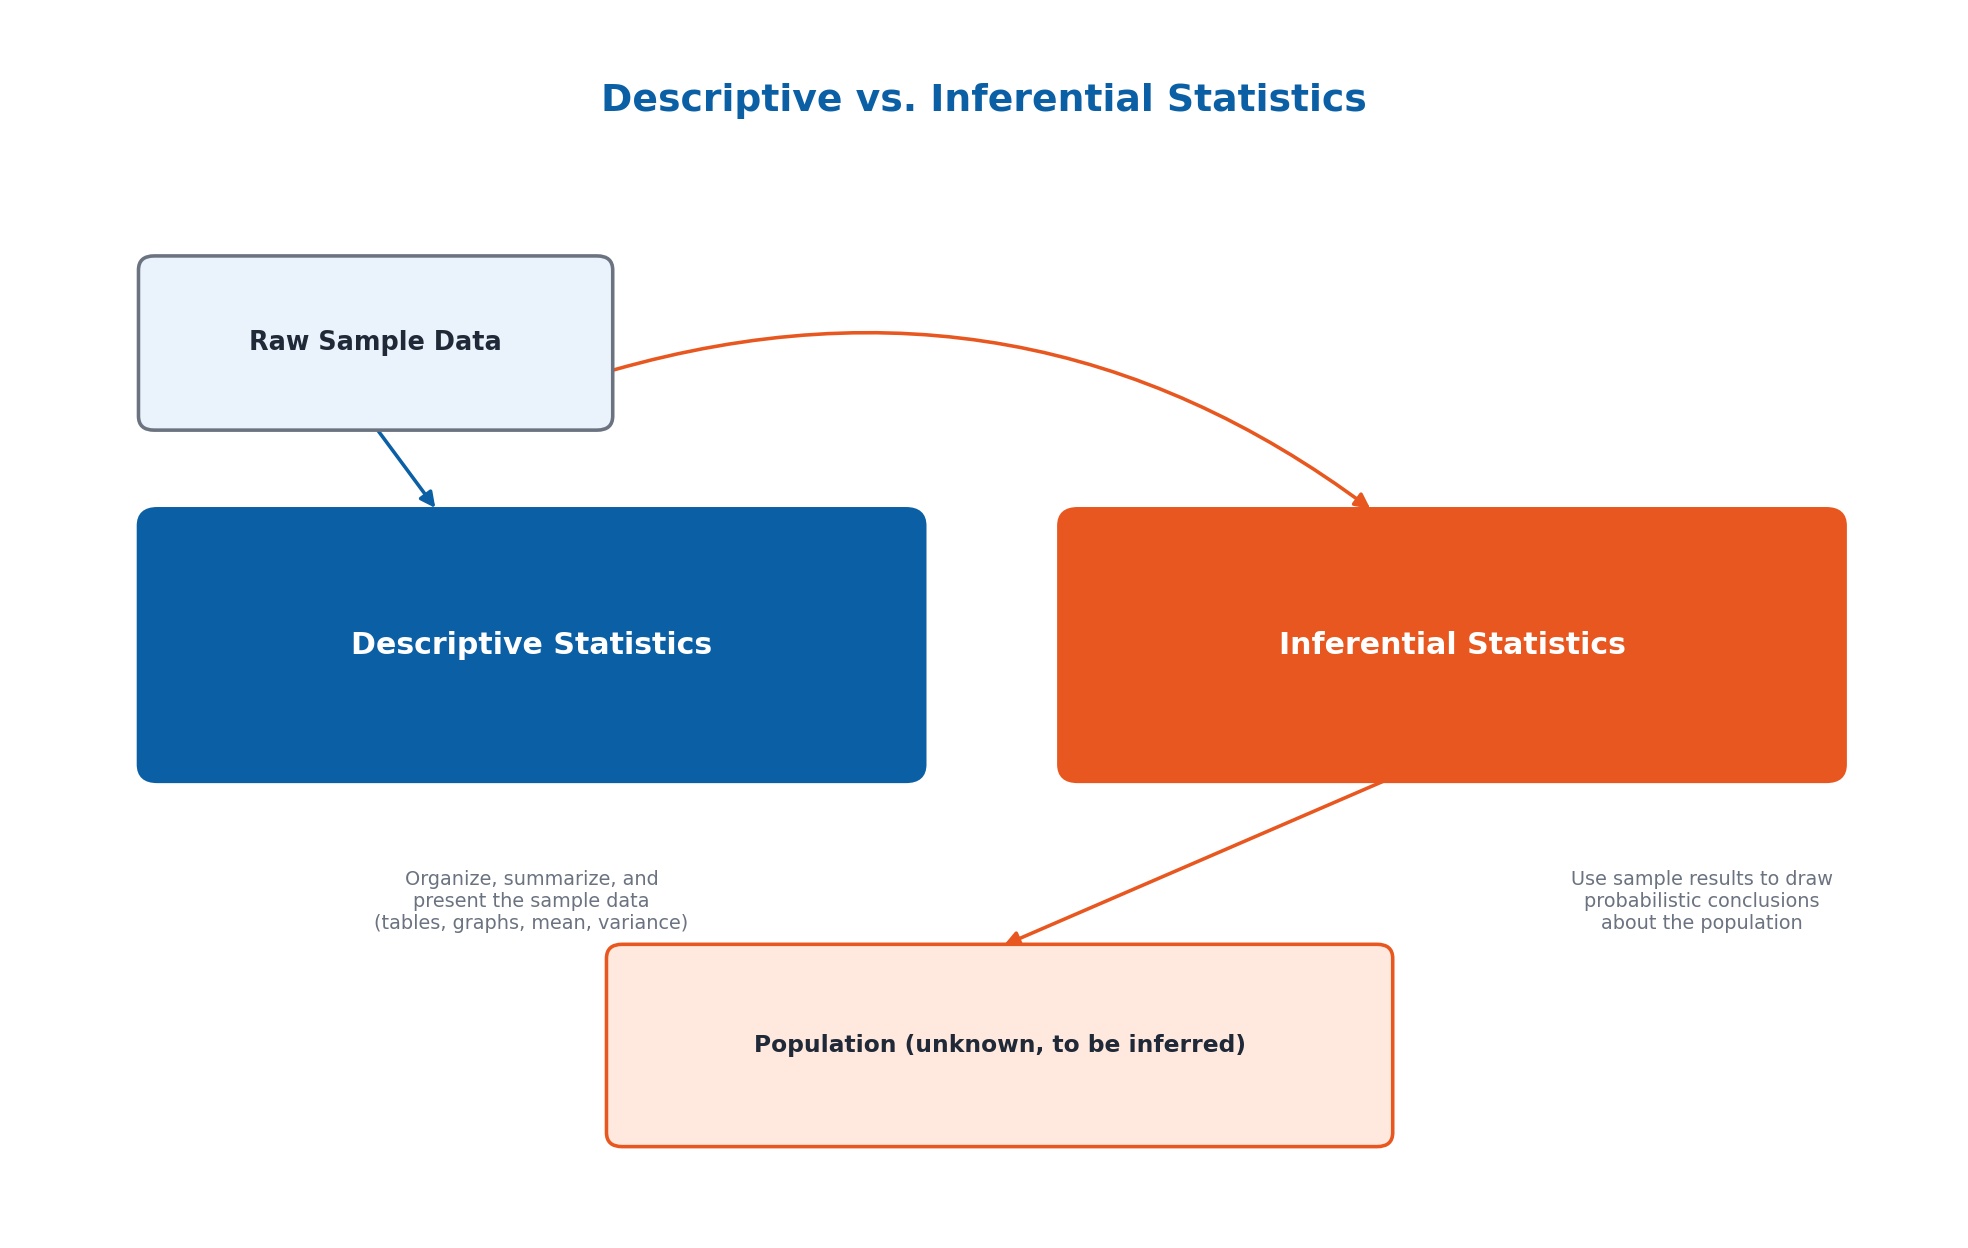
Descriptive statistics provides procedures for organizing data collected from a sample, summarizing it (through graphs and summary values like mean, proportion, and variance), and presenting those summaries in an understandable form. Inferential statistics is the process of inferring the characteristics of a population based on the characteristics of a sample — since this always involves some risk, inferential conclusions are expressed as probabilistic statements rather than proofs. Probability theory is the discipline that underlies and strengthens inferential statistics.
Important Definitions
What is population in statistics?
The total group under discussion, or the group to which the results of a statistical study will be generalized.
What is a sample?
A subset of the population, chosen because measurements of interest often cannot practically be made on the whole population; a good sample must be representative of the population.
What is a parameter?
A fixed, usually unknown quantity computed from an entire population.
What is a statistic?
A quantity computed from a sample; unlike a parameter, a statistic varies from sample to sample.
What is a quantitative variable?
A variable capable of taking a numerical value, further divided into continuous variables (any value in an interval) and discrete variables (only isolated, usually integer, values).
What is a qualitative (categorical) variable?
A variable that is not capable of numerical measurement, where observations are instead assigned to mutually exclusive categories, such as colour or sex.
What is descriptive statistics?
The branch of statistics concerned with organizing, summarizing, and presenting sample data in an understandable form.
What is inferential statistics?
The process of drawing conclusions about a population's characteristics based on the characteristics observed in a sample, expressed as probabilistic statements.
Key Facts and Relations
| Topic | Key Fact / Relation |
|---|---|
| Sigma (summation) notation | Sum from i=1 to n of Yi = Y1 + Y2 + … + Yn |
| Product notation | Product from i=1 to n of Yi = Y1 x Y2 x … x Yn |
| Factorial | n! = n(n-1)(n-2)…(2)(1); 0! = 1 |
| Linear additive model | Yi = mu + epsilon_i (observation = mean + random error) |
| Deviation from the mean | epsilon_i = Yi – mu |
| Proportion to percentage | Percentage = Proportion x 100 |
| Order statistics | Y(1) = minimum value; Y(n) = maximum value of the ordered data |
| Statistics applied by field | Economics = Econometrics; Biological Sciences = Biometry |
Diagrams
Population vs. Sample: A diagram showing a large population with a representative sample drawn from it, alongside the linked ideas of parameter (population) and statistic (sample)
Types of Variables: A classification diagram showing variables split into Quantitative (Discrete, Continuous) and Qualitative/Categorical types, with examples of each
Descriptive vs. Inferential Statistics: A diagram contrasting descriptive statistics (organizing and summarizing sample data) with inferential statistics (using the sample to draw conclusions about the population)
Short Questions & Answers
Define statistics as it is understood today.
Statistics is the mathematical science of making decisions and drawing conclusions from data in situations of uncertainty; it includes designing experiments, and collecting, organizing, summarizing, analyzing, and interpreting numerical data.
Differentiate between population and sample.
Population is the total group under discussion or to which results will be generalized, while a sample is a representative subset of that population chosen when measuring the whole population is not practical.
Differentiate between a parameter and a statistic.
A parameter is a fixed, usually unknown quantity computed from an entire population, while a statistic is a quantity computed from a sample and varies from sample to sample.
What is the difference between an experiment and a sample survey?
An experiment involves the researcher controlling the allocation of treatments to units, while a sample survey has no treatments — it instead involves control over the selection of units from a frame.
What is a discrete variable? Give an example.
A discrete variable is a quantitative variable that can take only isolated values, usually positive integers arising from counting, such as the number of students in a class.
What is a continuous variable? Give an example.
A continuous variable is a quantitative variable that can take any value within an interval on the number line, such as temperature or plant height.
Differentiate between descriptive and inferential statistics.
Descriptive statistics organizes, summarizes, and presents sample data, while inferential statistics uses that sample data to draw probabilistic conclusions about the wider population.
Explain factorial notation with an example.
Factorial, written n!, means n x (n-1) x (n-2) x … x 2 x 1; for example, 4! = 4x3x2x1 = 24, and by definition 0! = 1.
Long Questions & Answers
Explain the meaning and scope of statistics, tracing briefly how the word's meaning has changed since it was first used, and describe what the modern subject includes.
Where does the word 'statistics' come from, and how was it first used?
The word statistics traces back to the mid-18th century, when German scholar Gotfried Achenwall first used it to describe the science of statecraft concerned with the collection and use of data by the state. Some historians place an even earlier written appearance in a 1770 book called 'The Elements of Universal Erudition.' The term was used again with a wider definition in 1787, and it had appeared in the Encyclopedia Britannica by 1797. These early uses all tied the word closely to government record-keeping, well before it grew into the broad mathematical science recognized today.
How did the meaning of 'statistics' change from the 19th century into the modern era?
Through the 19th century, the meaning of statistics broadened considerably to cover numerical data on almost any subject, along with the interpretation of that data through appropriate methods of analysis. From the early 1920s onward, the rapid growth of the experimental sciences created a pressing need for reliable, scientific methods of analyzing experimental and survey results. It was largely out of these practical problems faced by experimenters that the modern subject of statistics developed, moving it far beyond its original narrow focus on state record-keeping.
What is the modern, formal definition and scope of statistics?
Statistics is now formally defined as the mathematical science of making decisions and drawing conclusions from data in situations of uncertainty. Its scope includes the design of experiments, and the collection, organization, summarization, analysis, and interpretation of numerical data. Modern statistics is quite different from its origins as a tool for gathering and presenting government data: it now incorporates probability theory and applied mathematics as core components. Computers allow statistical analysis to be performed routinely at a scale and speed once unimaginable, though computers themselves remain simply a tool for applying statistical theory rather than part of that theory.
How does everyday use of the word 'statistics' differ from its technical meaning?
In everyday, non-technical usage, the word 'statistics' often simply refers to numbers or facts, such as statistics on births, deaths, or road accidents. The word is also used as the plural of 'statistic,' which is a specific technical term referring to a quantity calculated from sample values. This casual usage is much narrower than the formal definition of statistics as a mathematical science, though it reflects the same historical root: a discipline built around counting and reporting data before it grew into today's methods of analysis and inference.
Explain the key statistical terms population, sample, parameter, and statistic, and describe how they relate to one another using a suitable example.
What is a population, and what is a sample?
The population is the total group under discussion — the entire group to which the results of a study will eventually be generalized. It represents the full scope of what a researcher ultimately wants to know something about. Because it is often impossible or impractical to measure every member of the population, a sample is used instead: a chosen subset of the population on which measurements are actually taken. For any conclusion drawn from a sample to be meaningful, the sample must genuinely represent the population, rather than being biased or unusual in a way that does not reflect the population as a whole.
What are a parameter and a statistic, and how do they differ?
A parameter is a quantity computed from the population when the entire population is available; because it describes the whole population directly, it is a fixed, constant value, though in practice it is usually unknown since measuring an entire population is often infeasible. A statistic, by contrast, is a quantity computed from a sample rather than the whole population. Because different samples drawn from the same population are not identical to one another, a statistic is inherently variable — its value depends on exactly which sample happened to be selected.
What is sampling variability?
Sampling variability is the natural tendency for different samples drawn from the same population to produce different values of a statistic. Because a sample is only a subset of the population, no two samples are likely to be composed of exactly the same individuals, so a statistic such as a mean or proportion calculated from one sample will usually differ, at least slightly, from the same statistic calculated from another sample. This variability is precisely why a sample statistic is never treated as an automatically exact stand-in for the fixed, underlying population parameter.
How do population, sample, parameter, and statistic apply in a concrete example?
Suppose 500 college students are surveyed and 300 are found to be female. Here, the set of all students at the college is the population, and the surveyed group of 500 is the sample drawn from it. The true proportion of female students across the entire college is the population's parameter — a fixed but likely unknown value. The proportion found within this particular sample, 300/500 or 60%, is the sample's statistic. A different sample of 500 students might well produce a different proportion, illustrating sampling variability in action.
Describe the two broad types of variables used in statistics, with their subtypes, and explain the difference between descriptive and inferential statistics.
What is a variable, and what makes a variable quantitative?
A variable is simply a characteristic that varies from one individual to another within a population; since natural phenomena rarely show perfect constancy, almost every measurable characteristic of interest qualifies as a variable. A quantitative variable is one capable of taking a genuine numerical value, such as the height of a plant, the weight of a bag of grain, or the number of students in a classroom. Quantitative variables are further split into continuous and discrete subtypes, depending on what kind of numerical values they can actually take.
What is the difference between a continuous and a discrete variable?
A continuous variable can take any value at all within some interval on the number line, such as atmospheric pressure, plant height, or body temperature — meaning that between any two possible values there are, in principle, infinitely many other possible values. A discrete, or discontinuous, variable can instead take only isolated, separate points on the number line. These values are usually positive integers arising from a simple counting process, such as the number of plants in a plot or the number of insects observed in a given area.
What is a qualitative (categorical) variable?
A qualitative, or categorical, variable is not capable of taking a numerical measurement at all. Instead, each observation is simply allocated to one of several mutually exclusive categories, and the resulting data can only be counted rather than measured. Examples include sex (male or female), general knowledge (poor, moderate, good), or colour (blue, green, red). Unlike quantitative variables, qualitative variables cannot be added, averaged, or expressed as continuous or discrete numerical quantities in their raw form.
What is the difference between descriptive and inferential statistics?
Descriptive statistics organizes raw data collected from a sample, summarizing it through graphs and calculated summary values, such as measures of central value and variability (the mean, a proportion, or the variance), and presenting those summaries clearly. Inferential statistics goes further: rather than just describing the sample collected, it uses the sample's descriptive results to infer or generalize characteristics of the broader population. Because this inference is never based on complete population information, it relies on probability theory, so its conclusions are always expressed as probabilistic statements carrying some acknowledged risk, rather than as absolute proof.
Multiple Choice Questions (MCQs)
Who is credited with first using the word 'statistics' in its modern sense? (A) Sir John Sinclair (B) Gotfried Achenwall (C) E.A.W. Zimmermann (D) Yule
Correct answer: (B) Gotfried Achenwall. Gotfried Achenwall, a German scholar, first used the word statistics in the mid-18th century for the science of statecraft.
The total group to which the results of a study will be generalized is called the: (A) Sample (B) Statistic (C) Population (D) Parameter
Correct answer: (C) Population. The population is the total group under discussion or to which the results will be generalized.
A quantity computed from an entire population is called a: (A) Statistic (B) Parameter (C) Sample (D) Variable
Correct answer: (B) Parameter. A parameter is a fixed quantity computed from a population, usually unknown in practice.
Which of the following best describes a statistic? (A) A fixed, constant population value (B) A quantity computed from a sample that varies from sample to sample (C) A category used for qualitative data (D) A type of experiment
Correct answer: (B) A quantity computed from a sample that varies from sample to sample. A statistic is computed from a sample and varies from sample to sample, unlike a fixed parameter.
Which of these is an example of a discrete variable? (A) Plant height (B) Atmospheric pressure (C) Number of students in a class (D) Body temperature
Correct answer: (C) Number of students in a class. The number of students in a class is a discrete variable, since it takes only isolated, whole-number values arising from counting.
Which of these is an example of a continuous variable? (A) Number of insects per plot (B) Eye colour (C) Number of plants per field (D) Plant height
Correct answer: (D) Plant height. Plant height is a continuous variable, since it can take any value within an interval on the number line.
What distinguishes an experiment from a sample survey? (A) Experiments involve no treatments (B) Experiments control the allocation of treatments; surveys control the selection of units (C) Sample surveys always use the entire population (D) There is no meaningful difference
Correct answer: (B) Experiments control the allocation of treatments; surveys control the selection of units. The distinguishing feature is control over allocation of treatments (experiments) versus control over selection of units (sample surveys).
What is the value of 4!? (A) 4 (B) 16 (C) 24 (D) 12
Correct answer: (C) 24. 4! = 4 x 3 x 2 x 1 = 24.
What does the value of 0! equal? (A) 0 (B) 1 (C) Undefined (D) -1
Correct answer: (B) 1. By definition, 0! = 1.
Descriptive statistics is primarily concerned with: (A) Predicting future population parameters (B) Testing hypotheses about unknown populations (C) Organizing, summarizing, and presenting sample data (D) Calculating probabilities of rare events
Correct answer: (C) Organizing, summarizing, and presenting sample data. Descriptive statistics organizes, summarizes, and presents the data collected from a sample.
Quick Revision Summary
- Statistics = mathematical science of making decisions and drawing conclusions from data under uncertainty
- Population = whole group of interest; Sample = representative subset actually measured
- Parameter = fixed value from population (usually unknown); Statistic = value from sample (varies by sample)
- Proportion x 100 = Percentage
- Experiment = control over allocation of treatments; Sample survey = control over selection of units
- Sigma (sum), Product (multiply), Factorial n! = n(n-1)…(1), with 0! = 1
- Quantitative variables: Continuous (any value in an interval) or Discrete (isolated/integer values)
- Qualitative/categorical variables cannot be measured numerically, only counted by category
- Descriptive statistics organizes/summarizes sample data; Inferential statistics draws conclusions about the population
Exam Tips
- Remember: Parameter = Population (both start with P); Statistic = Sample value that varies
- Discrete data comes from counting (whole numbers); Continuous data comes from measuring (any value)
- 0! = 1 is a common trick question — don't assume it's 0
- Econometrics = Statistics + Economics; Biometry = Statistics + Biology — useful for matching-type questions
- Descriptive statistics describes what you found; Inferential statistics generalizes beyond your sample
- Key distinguishing feature: experiments control allocation of treatments, surveys control selection of units