Biologists collect numbers all the time: heights, pulse rates, crop yields, numbers of infected people. Biostatistics is the branch of statistics that turns such data into reliable conclusions. Chapter 11 explains why it is needed and teaches three basic tools: the mean, the median and the mode, plus how to show data in a bar chart.
The worked examples in these notes use fresh data sets, so you can practise the method rather than memorise the textbook’s numbers.
Learning Objectives
- Define biostatistics and describe its main uses with examples.
- Define and calculate the mean of a data set.
- Define and find the median for an odd and an even number of values.
- Define and find the mode, including bimodal data and data with no mode.
- Draw and label a bar chart from biological data.
Key Concepts
11.1 What Is Biostatistics?
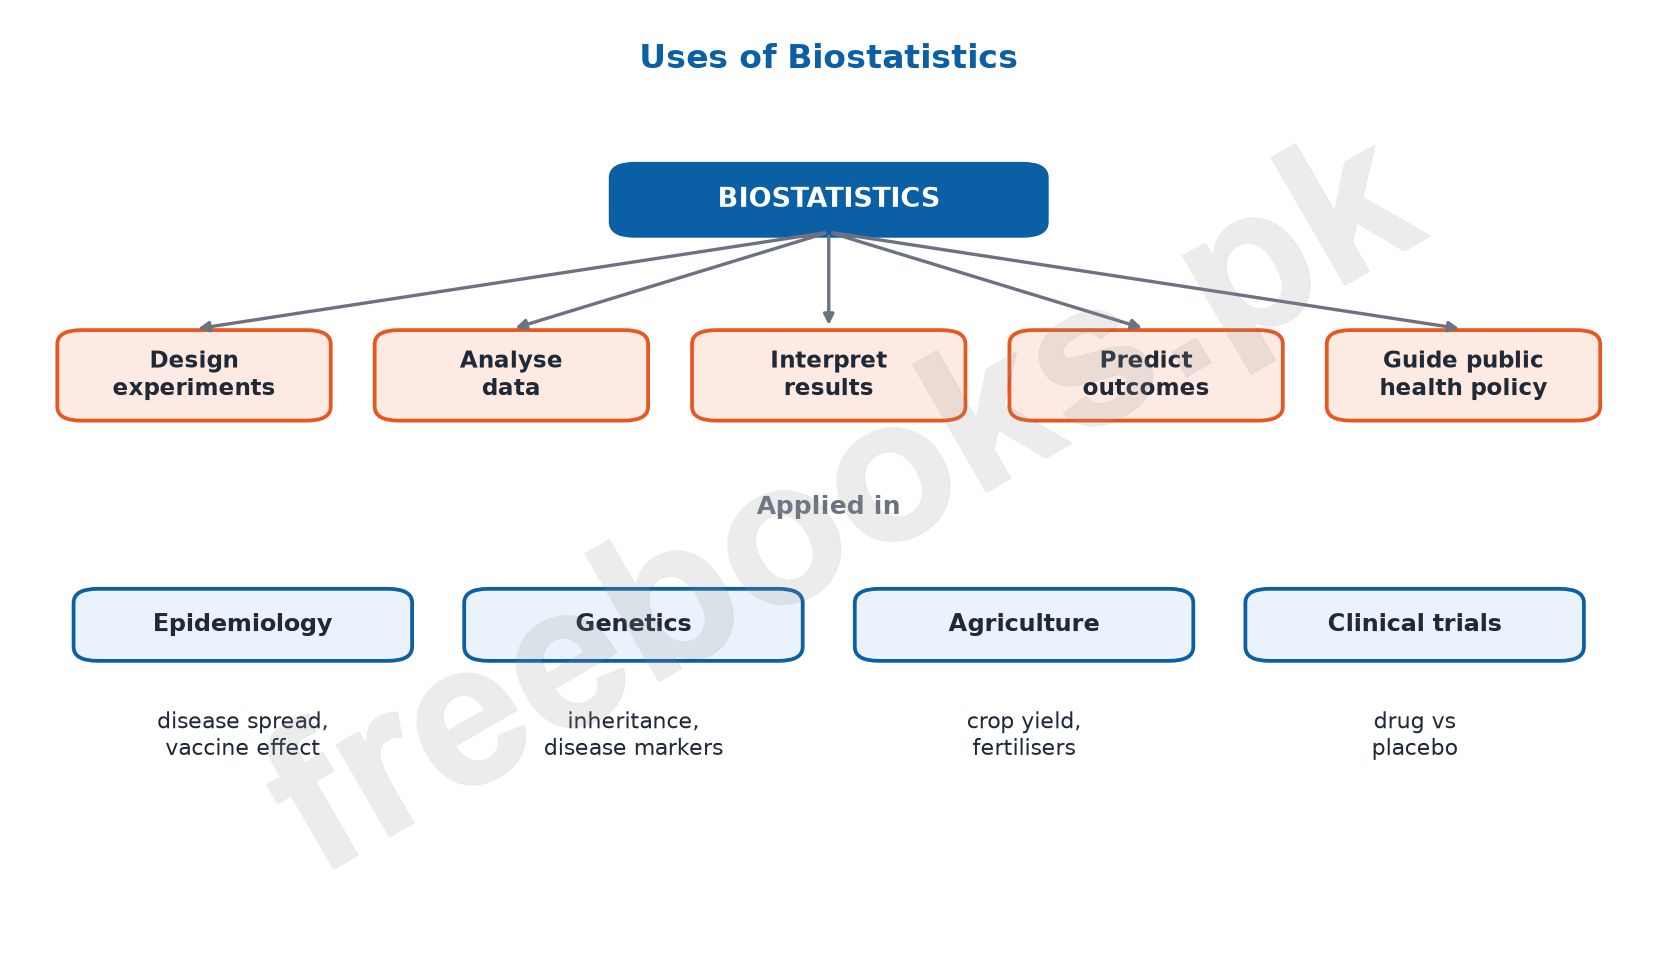
Biostatistics is the application of statistical methods to biology, medicine and agriculture. It is essential for planning experiments, clinical trials and studies of disease in populations.
Designing experiments: it decides how many subjects or samples are needed and how to group them, for example the sample size of a drug trial. Analysing data: it reveals trends, patterns and relationships, for example how light and water affect plant growth. Interpreting results: it tells whether a difference is real or could be due to chance.
Predicting outcomes: models built from current data forecast things such as the spread of an infectious disease, so vaccines and hospital beds can be planned. Public health and policy: governments base decisions such as vaccination campaigns on statistical evidence.
11.1 Fields That Use Biostatistics
Epidemiology: studying how diseases are distributed in populations, infection and recovery rates, and how well vaccines work. Genetics: studying how traits are inherited and finding genetic markers linked to diseases such as diabetes. Agriculture: comparing crop varieties, fertilisers and pest resistance. Clinical trials: testing whether a new medicine works better than a placebo.
11.2 Mean
The mean (average) is the sum of all values divided by the number of values: Mean = (sum of values) ÷ (number of values). It gives an overall central value.
Example: resting pulse rates (beats per minute) of five students are 72, 68, 80, 75 and 70. Sum = 365; number of values = 5; mean = 365 ÷ 5 = 73 beats per minute.
The mean uses every value, but one very large or very small value (an outlier) can pull it away from the typical value.
11.2 Median
The median is the middle value when data are arranged in order. First arrange the values in ascending (or descending) order. If the number of values n is odd, the median is the value at position (n + 1) ÷ 2. If n is even, the median is the average of the values at positions n ÷ 2 and (n ÷ 2) + 1.
Odd example: the pulse rates above in order are 68, 70, 72, 75, 80. n = 5, position (5 + 1) ÷ 2 = 3, so the median is 72.
Even example: add a sixth student with 78: 68, 70, 72, 75, 78, 80. n = 6, so take positions 3 and 4: (72 + 75) ÷ 2 = 73.5.
The median is not affected much by outliers, so it is useful for skewed data such as incomes or hospital stay lengths.
11.2 Mode
The mode is the value that occurs most often. Count how often each value appears; the value with the highest frequency is the mode.
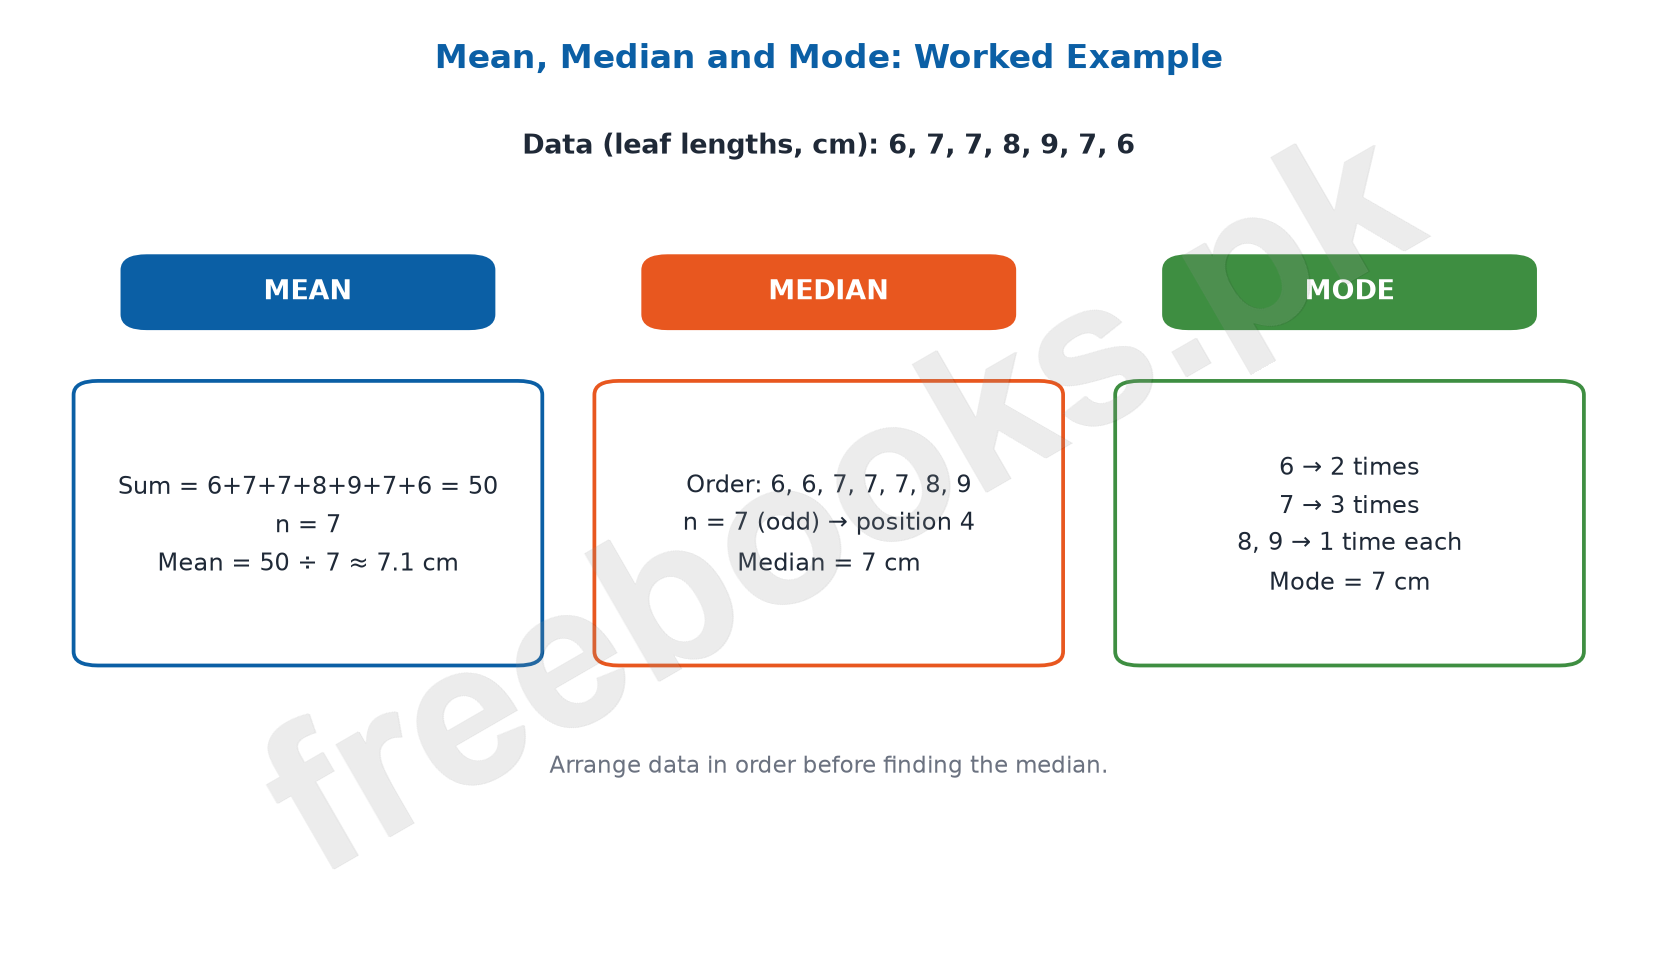
Example: lengths of seven leaves (cm) are 6, 7, 7, 8, 9, 7, 6. The value 7 occurs three times, more than any other, so the mode is 7 cm.
A data set can have two modes (bimodal): 4, 5, 5, 6, 6, 7 has modes 5 and 6. If every value occurs equally often, as in 3, 4, 5, 6, there is no mode. The mode is the only one of the three measures that also works for categories, such as the most common blood group in a class.
11.3 Bar Chart
A bar chart shows data for separate categories using bars whose heights (or lengths) are proportional to the values. It makes comparison between categories quick and clear.
Steps: (1) collect the data; (2) arrange it as categories with their values; (3) draw the x-axis and y-axis; (4) label the x-axis with the categories and the y-axis with the quantity and its unit; (5) choose a suitable scale with equal intervals that covers the largest value; (6) draw bars of equal width with equal gaps, each reaching its value; (7) give the chart a title and label the bars.
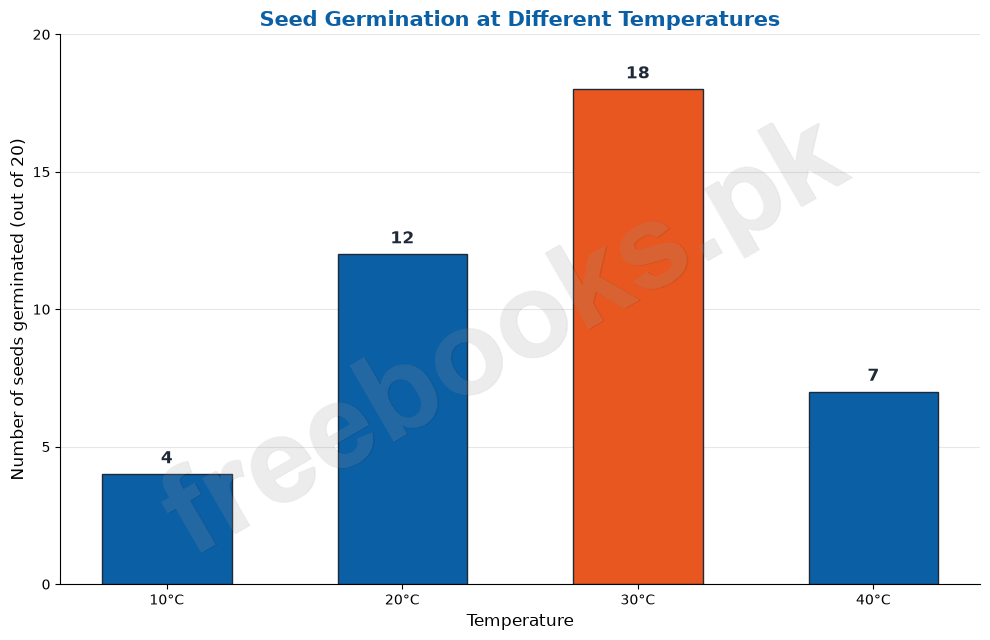
Example: number of seeds (out of 20) that germinated at different temperatures: 10°C – 4, 20°C – 12, 30°C – 18, 40°C – 7. The largest value is 18, so a y-axis from 0 to 20 in steps of 5 works well. The chart shows germination is highest at 30°C.
Important Definitions
Statistics
The science of collecting, organising, analysing and interpreting numerical data.
Biostatistics
The application of statistical methods to biological and medical sciences.
Data
Facts or measurements collected for study.
Epidemiology
The study of the distribution and causes of diseases in populations.
Clinical trial
A planned study that tests a new medicine or treatment on people.
Placebo
A dummy treatment with no active substance, used for comparison in trials.
Mean
The sum of all values divided by the number of values.
Median
The middle value of data arranged in order.
Mode
The value that occurs most frequently in a data set.
Bimodal
A data set with two modes.
Outlier
A value much larger or smaller than the rest of the data.
Bar chart
A graph that uses bars of equal width to compare values of different categories.
Key Facts at a Glance
| Measure | How to find it / best use |
|---|---|
| Mean | Sum ÷ number of values · overall average |
| Median (n odd) | Value at position (n + 1) ÷ 2 |
| Median (n even) | Average of values at n ÷ 2 and n ÷ 2 + 1 |
| Median | Best for skewed data / outliers |
| Mode | Most frequent value · works for categories |
| Possible modes | One, two (bimodal), more, or none |
| Bar chart | Categories on x-axis, values on y-axis, equal widths and gaps |
Diagrams
Uses of biostatistics: A chart of the five main uses of biostatistics and four fields where it is applied.
Mean, median and mode worked out: A step-by-step worked example finding the mean, median and mode of a small data set.
Example bar chart: A bar chart of the number of seeds germinating at four temperatures, with labelled axes and scale.
Short Questions and Answers
Define biostatistics.
Biostatistics is the use of statistical methods to collect, analyse and interpret data in biology, medicine and agriculture.
Why is biostatistics needed when planning a drug trial?
It decides how many patients are needed and how to divide them into groups, so that a real effect of the drug can be detected reliably.
Give one example of biostatistics in agriculture.
Comparing the yield of several wheat varieties grown with different fertilisers to find the best combination.
How can biostatistics help during an epidemic?
By analysing infection and recovery rates it can predict how the disease will spread, so vaccination and hospital resources can be planned.
Find the mean of 12, 15, 9, 14.
Sum = 50; number of values = 4; mean = 50 ÷ 4 = 12.5.
Find the median of 21, 18, 25, 19, 23.
In order: 18, 19, 21, 23, 25. n = 5, position 3, so the median is 21.
Find the median of 8, 3, 6, 10.
In order: 3, 6, 8, 10. n = 4, so median = (6 + 8) ÷ 2 = 7.
Find the mode of 2, 4, 4, 5, 4, 2, 6.
4 occurs three times, more than any other value, so the mode is 4.
When does a data set have no mode?
When every value occurs the same number of times, so no value is more frequent than the others.
Why is the median sometimes better than the mean?
Because one extreme value (outlier) changes the mean a lot but hardly changes the median.
What should be kept the same for all bars in a bar chart?
The width of the bars and the gaps between them; only the height should change with the value.
Long Questions and Answers
Describe the uses of biostatistics with examples.
How does it help in designing studies?
It plans the number of samples and the grouping in an experiment or clinical trial so the data collected can answer the question.
How does it help in analysing and interpreting data?
It reveals trends and relationships, such as the effect of light on plant growth, and tells whether differences are real or due to chance.
How does it help in prediction and policy?
Models made from data predict outcomes such as disease spread, and the evidence guides health policies such as vaccination campaigns.
Which fields depend on biostatistics?
Epidemiology, genetics, agriculture and clinical trials all use it to draw reliable conclusions from data.
Explain mean, median and mode with worked examples.
How is the mean calculated?
Add all values and divide by their number. For 72, 68, 80, 75, 70: 365 ÷ 5 = 73.
How is the median found for an odd number of values?
Arrange in order and take the value at position (n + 1) ÷ 2. For 68, 70, 72, 75, 80 the median is the 3rd value, 72.
How is the median found for an even number of values?
Take the average of the two middle values. For 68, 70, 72, 75, 78, 80 the median is (72 + 75) ÷ 2 = 73.5.
How is the mode found?
Count the frequency of each value; the most frequent is the mode. In 6, 7, 7, 8, 9, 7, 6 the mode is 7. Data can be bimodal or have no mode.
Describe how to draw a bar chart from biological data.
How is the data prepared?
Collect the data and arrange it in a table of categories and their values, such as temperature and number of seeds germinated.
How are the axes drawn and labelled?
Draw the x-axis for categories and the y-axis for values; label both, including the unit of the values.
How is the scale chosen?
Look at the largest value and choose equal intervals that cover it, for example 0 to 20 in steps of 5 for a largest value of 18.
How are the bars drawn?
Draw a bar for each category up to its value, keeping all bars the same width with equal gaps, then add a title and labels.
Multiple Choice Questions (MCQs)
Biostatistics applies statistics to: (A) Physics (B) Biological sciences (C) Literature (D) Economics only
Correct answer: (B) Biological sciences. Bio + statistics.
The mean of 4, 6, 8, 10 is: (A) 6 (B) 7 (C) 8 (D) 28
Correct answer: (B) 7. 28 ÷ 4 = 7.
The median of 3, 9, 5, 7, 1 is: (A) 5 (B) 7 (C) 3 (D) 25
Correct answer: (A) 5. In order 1, 3, 5, 7, 9; middle = 5.
The median of 2, 4, 6, 8 is: (A) 4 (B) 5 (C) 6 (D) 20
Correct answer: (B) 5. (4 + 6) ÷ 2 = 5.
The mode of 1, 3, 3, 3, 5, 5 is: (A) 1 (B) 3 (C) 5 (D) No mode
Correct answer: (B) 3. 3 occurs most often.
The data set 2, 2, 4, 4, 6 is: (A) Unimodal (B) Bimodal (C) Without a mode (D) Has median 2
Correct answer: (B) Bimodal. 2 and 4 each occur twice.
For n = 7 values, the median is at position: (A) 3 (B) 3.5 (C) 4 (D) 7
Correct answer: (C) 4. (7 + 1) ÷ 2 = 4.
Which measure is least affected by an outlier? (A) Mean (B) Median (C) Sum (D) Range
Correct answer: (B) Median. The median depends only on the middle position.
Which measure can be used for blood groups (A, B, AB, O)? (A) Mean (B) Median (C) Mode (D) None
Correct answer: (C) Mode. Mode works for categories.
In a bar chart, all bars must have equal: (A) Height (B) Width (C) Colour value (D) Label
Correct answer: (B) Width. Only height varies with value.
Comparing a new drug with a placebo is an example of: (A) Epidemiology (B) A clinical trial (C) Genetics (D) Agriculture
Correct answer: (B) A clinical trial. Clinical trials test treatments.
Predicting the spread of an infection helps in: (A) Designing bar charts (B) Planning vaccination campaigns (C) Finding the mode (D) Grafting
Correct answer: (B) Planning vaccination campaigns. Prediction guides resource planning.
Quick Revision Summary
- Biostatistics = statistics applied to biology; uses: design, analyse, interpret, predict, guide policy.
- Fields: epidemiology, genetics, agriculture, clinical trials.
- Mean = sum ÷ number of values.
- Median: arrange in order; n odd → position (n + 1) ÷ 2; n even → average of positions n ÷ 2 and n ÷ 2 + 1.
- Mode = most frequent value; data may be bimodal or have no mode.
- Bar chart: categories on x-axis, values on y-axis, equal scale intervals, equal bar width and gaps, title and labels.
Exam Tips
- Always arrange data in order before finding the median; this is the most common mistake.
- Show your working (sum, number of values, position) to get full marks even if you slip in arithmetic.
- Check for bimodal data and ‘no mode’ cases in MCQs.
- In bar charts, label both axes with units and choose a scale that uses most of the graph paper.
- Learn one real example for each use of biostatistics (drug trial, disease spread, crop yield).
Note on Facts
In the textbook’s odd-number median example, the position is written as (4/2) = 3. The correct calculation is (n + 1) ÷ 2 = (5 + 1) ÷ 2 = 3; the answer (160 cm) is right.
The textbook’s chapter pages carry the running header ‘Plant Physiology’; the chapter is Biostatistics.